Your shopping cart is empty!
Shopping Cart
0 item(s) - FreeCustomization and Conversion for: MetaTrader(MT4, MT5), Thinkorswim, NinjaTrader, MultiCharts, Tradingview, Prorealtime, SierraChart, etc.
License renew price will be 20% off for the 2nd year and after.
Featured

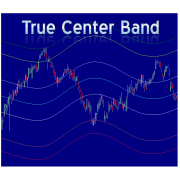
True Center Band (TCB) indicator and Market Analyzer for NinjaTrader 8 1 year
 indicator and Market Analyzer for NinjaTrader 8 1 year")
") (
(Please note that this purchase is a 1-Year license. About License renew.
You can add more than one instance with different timeframe and inputs.
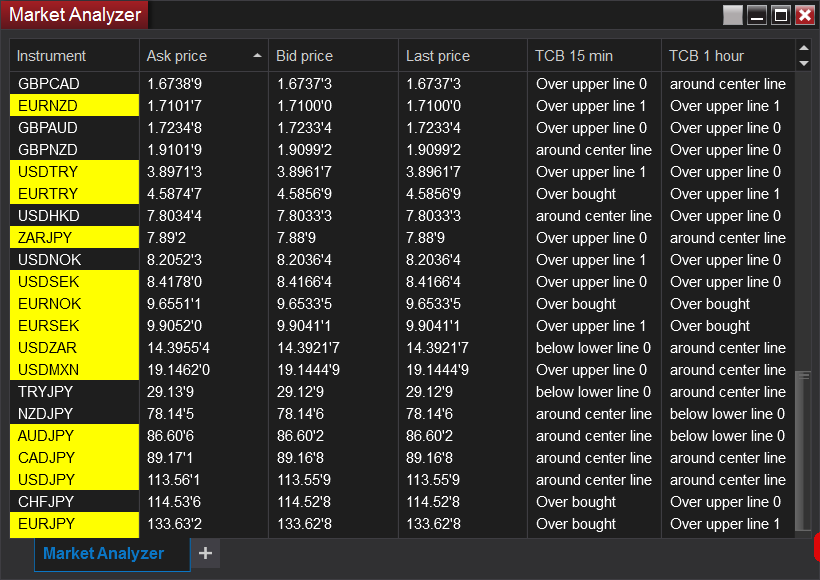
It will display the relative position of current price and bands.
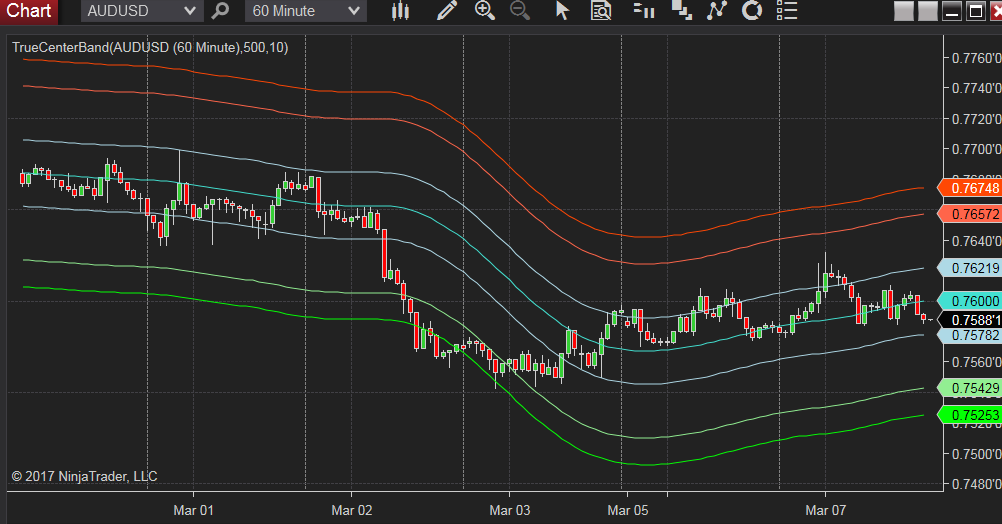
You might wonder, is there an indicator can show the trend, different levels of support and
resistance, and the boundary of price action? The answer is yes, True Center Band (TCB) indicator is
capable of doing all of them.
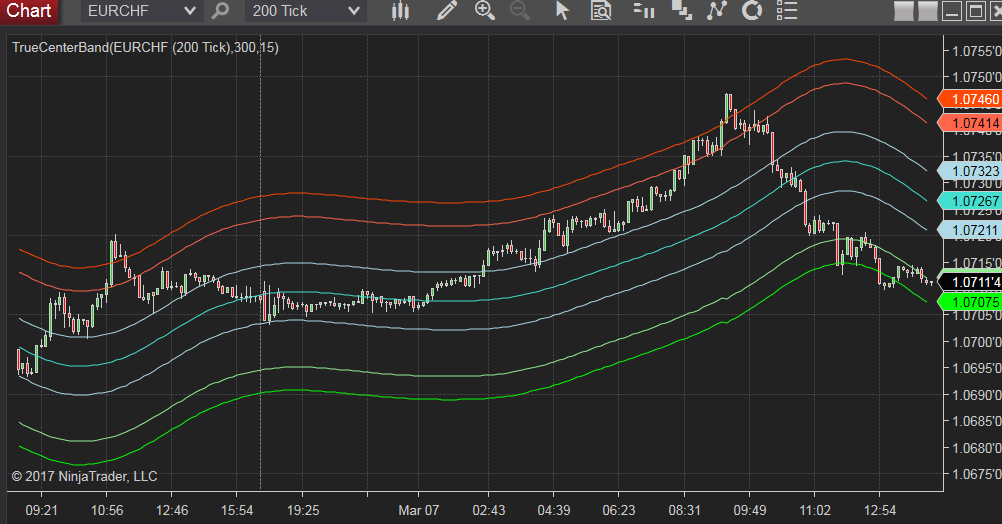
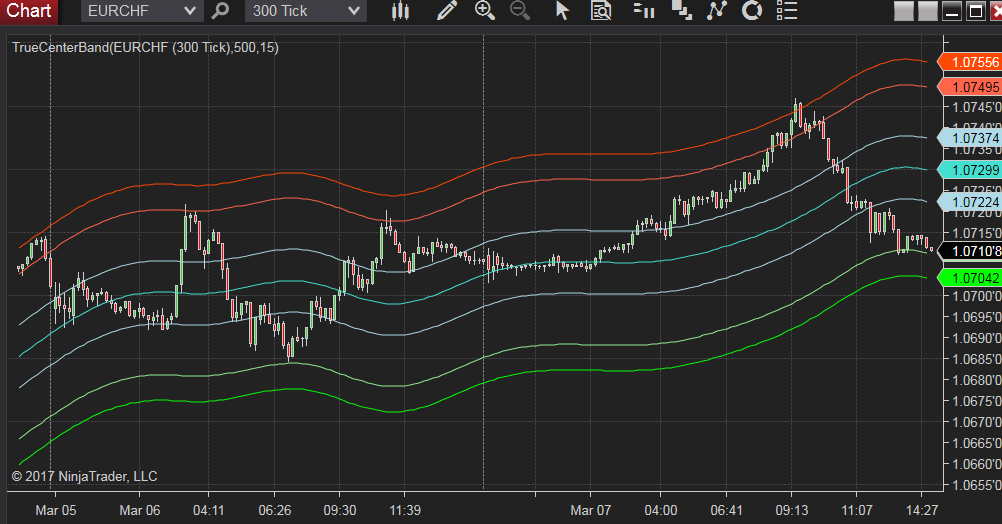
It consists of one center line to measure the center of price range within a given period,
and three channels (bands) represent different support and resistance levels.
True Center Band may look like some other indicators, such as Center of Gravity (COG) and polynomial
Regression Channel (PRC). But there is one major difference, TCB never repaints, because it is not
calculated by future data. Reliability makes TCB looks good, works better.
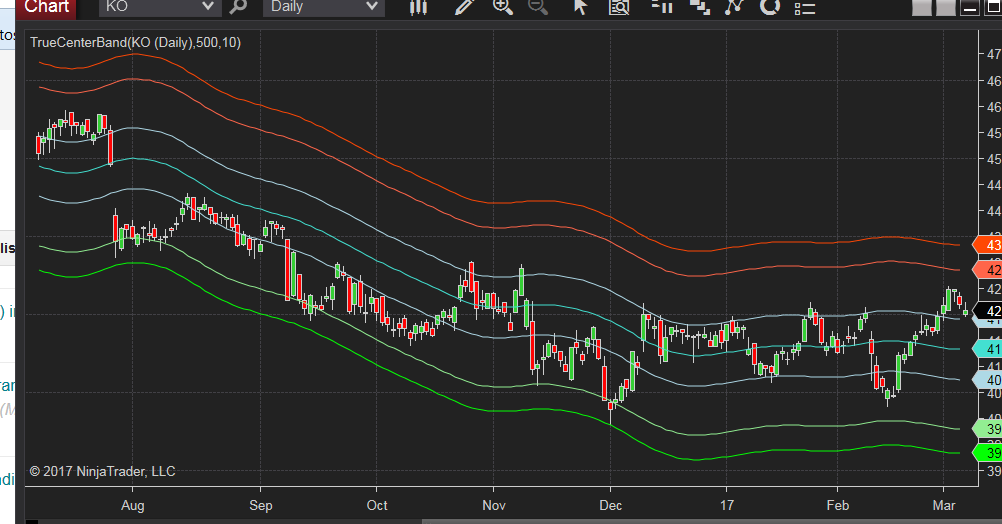
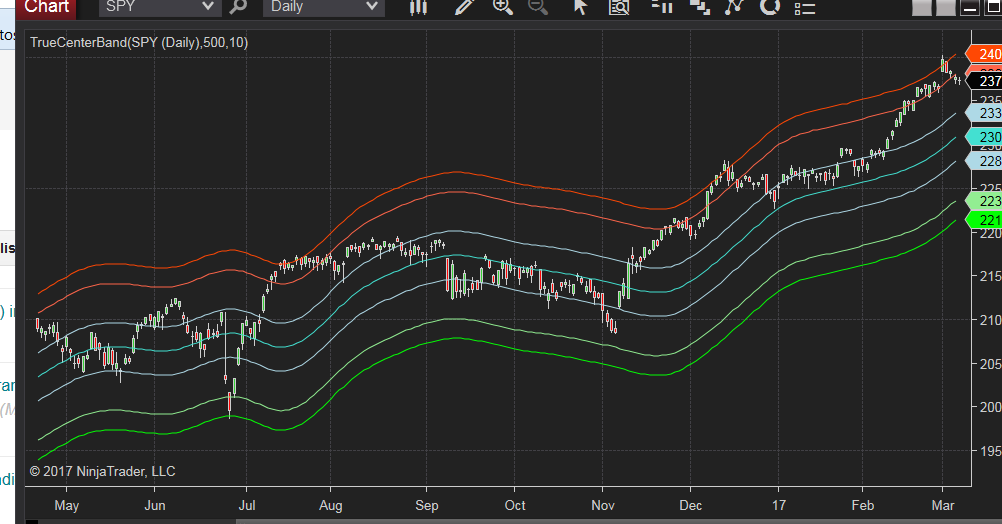
True Center Band is specially designed to work on all intraday charts (tick, mins, renko, range, etc.) and daily chart.
It also works on all markets (Stocks, Futures, Forex, Options, ETF, etc.)
The following image shows where you can find the TCB column in Market Analyzer.

Please make sure the "Bars to load" has the same value on both Market Analyzer and chart.

You can add more than one instance with different timeframe and inputs.
It will display the relative position of current price and bands.
For more details, please check the NinjaTrader 7 version description.
http://www.patternsmart.com/cart/index.php?route=product/product&product_id=311&search=tcb


Write a review
Your Name:Your Review: Note: HTML is not translated!
Rating: Bad Good
Enter the code in the box below:


Latest


Welcome to Patternsmart
Converting your indicator from one platform to another.Custom Alert, Autotrader, Indicators, Scan, Screener, Strategy and Signals.
Copyright @ 2023 Patternsmart - All rights reserved
This website is for educational and informational
purposes only and should not be considered a solicitation to buy or sell a
futures contract or make any other type of investment decision. It's not recommended to use any single indicator as sole evaluation criteria. The companies
and services listed on this website are not to be considered a recommendation
and it is the reader's responsibility to evaluate any product, service, or
company. patternsmart is not responsible for the accuracy or content of any
product, service or company linked to on this website.
Futures trading
contains substantial risk and is not for every investor.Please read the following risk disclosure before considering the
trading of this product:
Futures Risk Disclosure. An investor could
potentially lose all or more than the initial investment. Risk capital is money
that can be lost without jeopardizing ones financial security or life style.
Only risk capital should be used for trading and only those with sufficient risk
capital should consider trading. Past performance is not necessarily indicative
of future results.
Trading stocks, options, futures and forex involves
speculation, and the risk of loss can be substantial.Investor must consider all
relevant risk factors, including their own personal financial situation, before
trading. Trading foreign exchange on margin carries a high level of risk, as
well as its own unique risk factors. Forex investments are subject to
counter-party risk, as there is no central clearing organization for these
transactions. Please read the following risk disclosure before considering the
trading of this product:
Forex Risk Disclosure. Spreads, Straddles, and other multiple-leg option
strategies can entail substantial transaction costs, including multiple
commissions, which may impact any potential return. Options are not suitable for
all investors as the special risks inherent to options trading may expose
investors to potentially rapid and substantial losses. Prior to trading options,
you should carefully read
Characteristics and Risks of Standardized Options.
patternsmart.com
will not be held liable for the loss of money or any damage caused from relying
on the information on this site. Any investment decision you make in your account is solely your responsibility.
TESTIMONIAL DISCLOSURE: TESTIMONIALS APPEARING ON OUR SITE MAY NOT BE REPRESENTATIVE OF THE EXPERIENCE OF OTHER CLIENTS OR CUSTOMERS AND IS NOT A GUARANTEE OF FUTURE PERFORMANCE OR SUCCESS.