Shopping Cart
0 item(s) - FreeCustomization and Conversion for: MetaTrader(MT4, MT5), Thinkorswim, NinjaTrader, MultiCharts, Tradingview, Prorealtime, SierraChart, etc.
License renew price will be 20% off for the 2nd year and after.
Flow of Fund divergence indicator and Market Analyzer for Ninjatrader 8 with auto self backtest and alert.
VIP member get 10% off, click here to become a VIP member.
This is a 1-year license. About License renew.
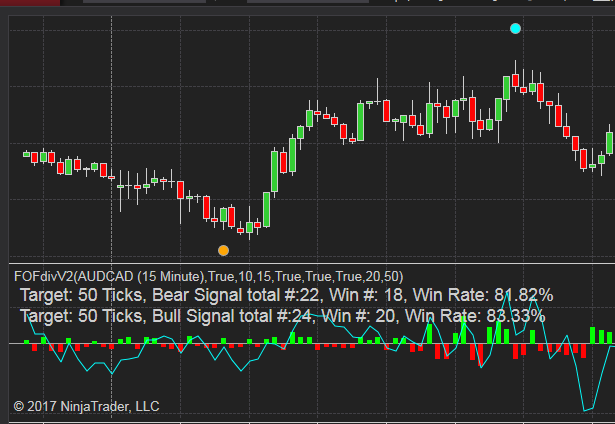
The most recent Flow of Fund divergence indicator best input combination and back test results.
You can get this indicator for FREE if you can find any indicator(with price less than $1000) that can beat our back test results.
Before purchasing, please make sure you read all the information and understand how this indicator works.
The reason I created this indicator is that I was asked many times about what was the best input for some indicators, it is a wonderful question, but it's also the hardest one to answer. Based on my knowledge, the best input for an indicator is not fixed, it varies and all depends on the market(FX, STOCK or FUTURE), profit target and timeframe you test it.
For example, MACD is a very popular indicator with couple inputs, but what is the best combination for it? Assuming we have an input combination which is excellent in 5 min chart for FX pair USD/CAD with a 30 ticks profit target, and we found this combination in a backtest range of 2000 bars. But if you test this combination in 500 bars, the result could be awful. Further than that, you may not get the same performance with this input combination in other FX pairs, even with the same timeframe and backtest range.
My conclusion is that the best input of indicators only exists in certain conditions. The best input of an indicator may vary in different timeframes, profit target and market. One combination cannot archive the best results in all conditions, in order to acquire the best performance, we need to explore unique input combinations in different situations.
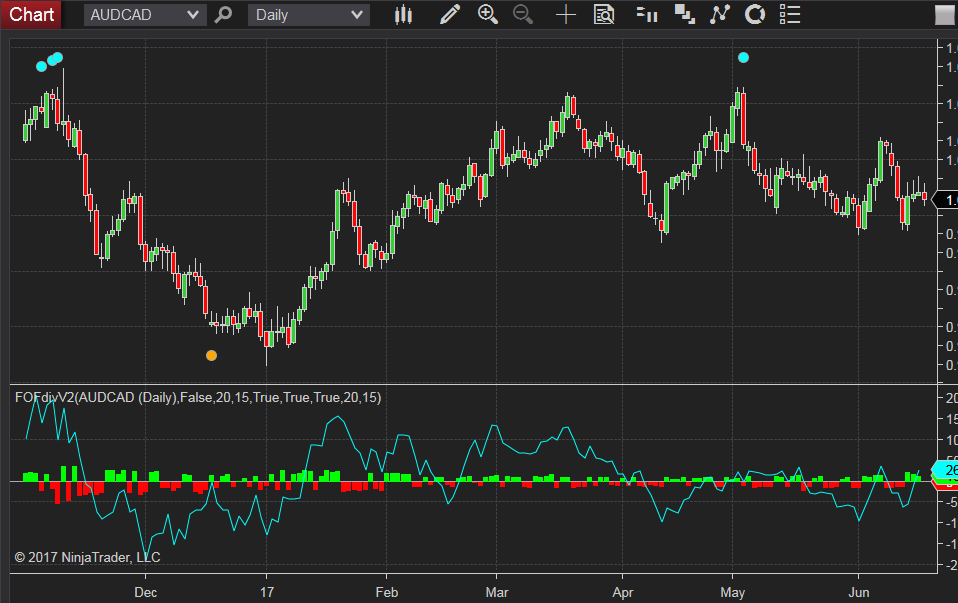
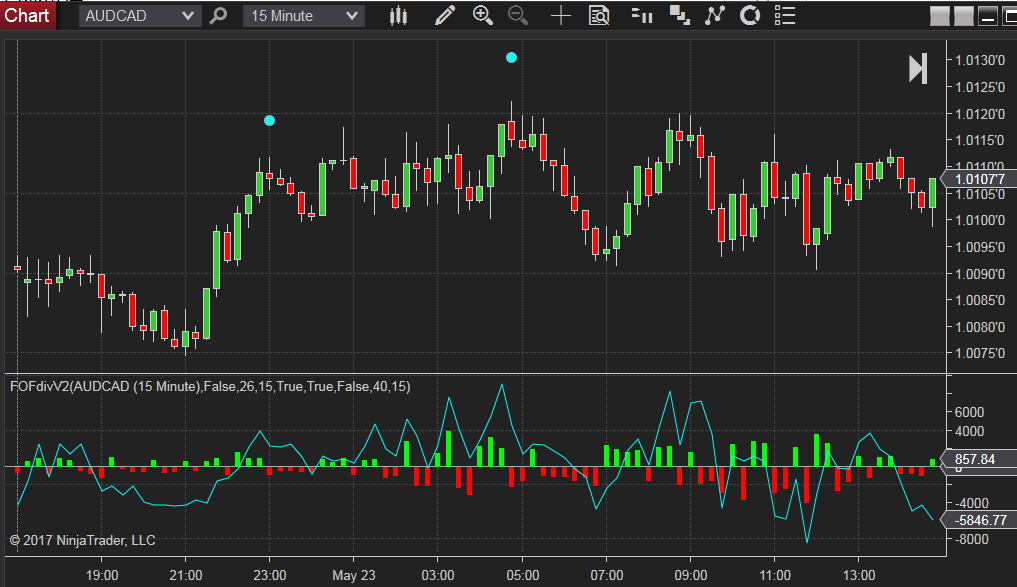
The Flow of fund(FOF) divergence signal indicator consists of the following parts: The Flow of fund histogram, FOF trend line, back test result in sub chart and divergence signal in main chart. The signal is instantly drawn on the current bar and will not repaint.
The HISTOGRAM shows an approximate amount of money to get in or out of the market within 1 bar. If selling pressure is stronger than buying pressure, it will be a red histogram, otherwise, it will be a green histogram.
Flow of fund trend line indicates the short or long term movement of the flow, determined by the "Length of FOF" input you set.
The back test result is calculated based on the current chart setting and indicator inputs combination.
It works on all official timeframes, not work on Renko chart.
Divergence
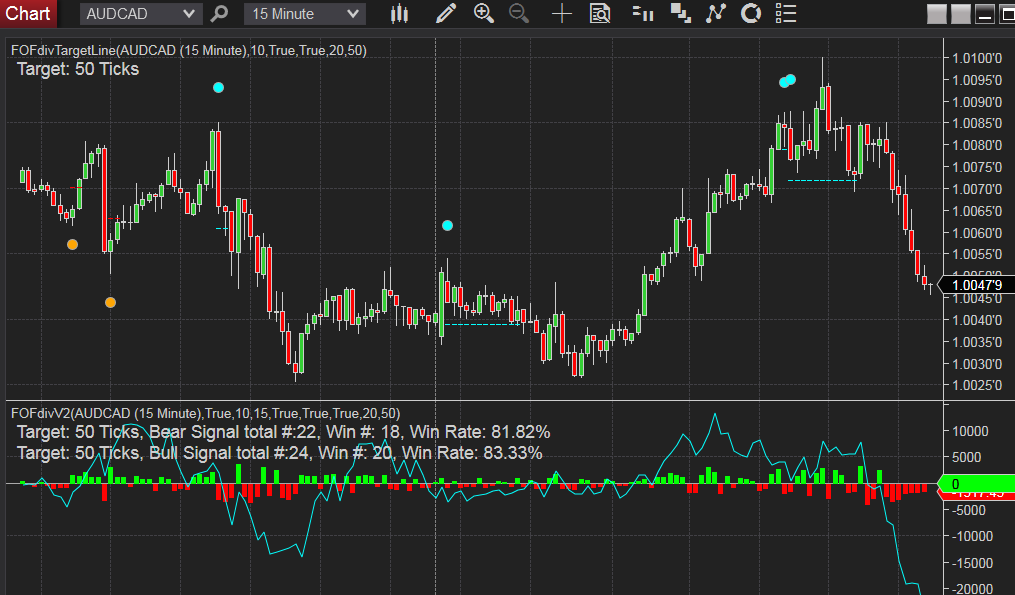
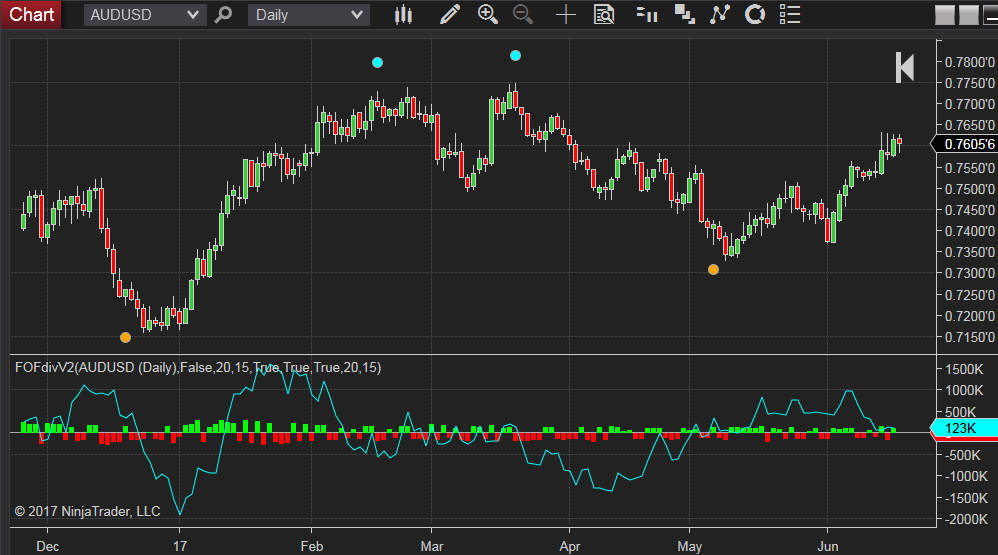
The divergence signal has two types, bearish and bullish. A blue dot will be drawn above the price candle bar when there is a bearish divergence between FOF and price trend. A yellow dot will be drawn below the price candle bar when there is a bullish divergence between FOF and price trend.
Let’s use the char below to explain how a divergence signal is detected.
A bullish divergence occurs when the price hit a lower low and the FOF line is in uptrend.
A bearish divergence occurs when the price hit a higher high and the FOF line is in downtrend.
There is a sound alert when a signal appear, you can turn it on/off from the input.
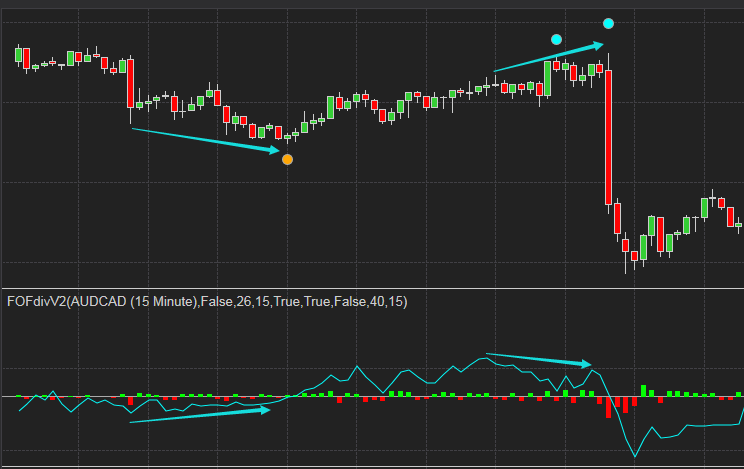
The divergence signals depend on both price and FOF value, different input combination will generate different signals.
One input combination could be very good for bearish divergence signal, but it may cause bad performance to bullish signal. In this case, it's recommended to use two FOF DIV indicator at the same time with different settings to get better result for both bullish and bearish signals. In order to do that, you will need to turn OFF Show Bear Signal input for one of them and turn OFF Show Bull Signal input for another.
The chart below is an example of loading two FOF DIV with different settings.
Backtest result
The most useful function of this indicator is the automatic backtest.
It makes possible for users to know in advance whether the inputs could lead to a good result or not. All you need to do is trying different input combinations until you find one which is good enough for you.
There are thousands of different combinations of input, it will take quite a while to find the best one for a single symbol in a one timeframe. If you don't have the time to do the test, we also provide a service to help you with this task. Please check our Flow of Fund divergence indicator best input combination data mining service.
Please note that the auto target line shown in the chart below is sold separately.
Some videos:
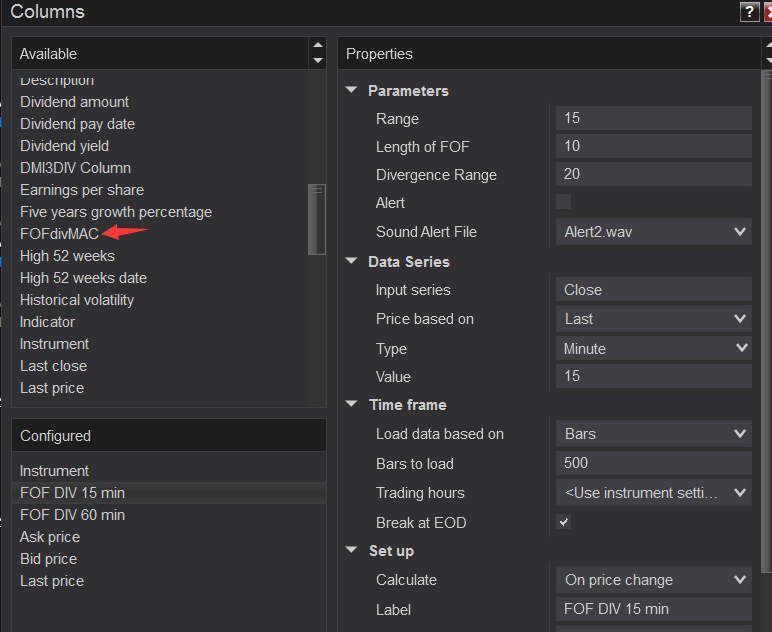
The following image shows where you can find the FOF DIV column in Market Analyzer.
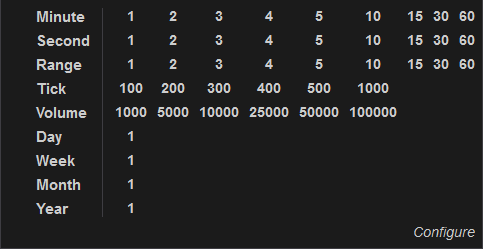
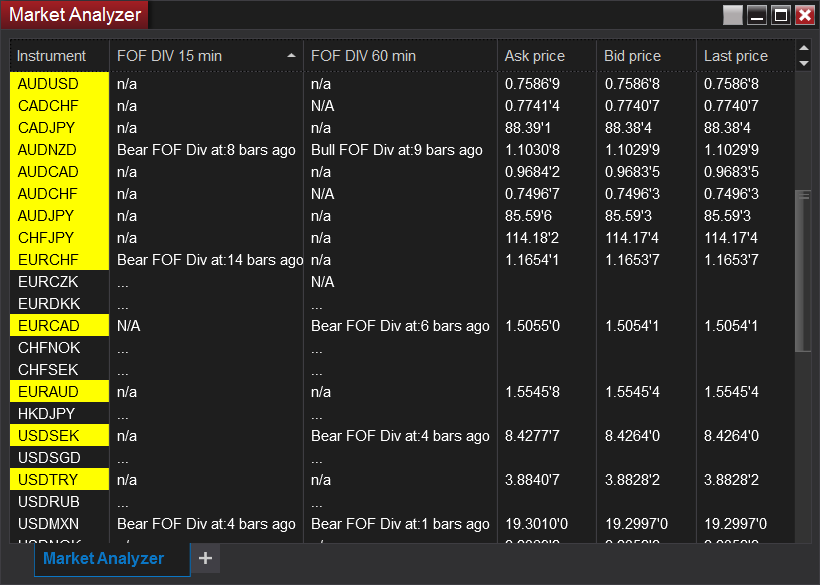
The input "Range" is used to detect if there was a bear or bull signal within that number of bars.
Write a review
Your Name:Your Review: Note: HTML is not translated!
Rating: Bad Good
Enter the code in the box below:
Custom Alert, Autotrader, Indicators, Scan, Screener, Strategy and Signals.
Copyright @ 2023 Patternsmart - All rights reserved
This website is for educational and informational
purposes only and should not be considered a solicitation to buy or sell a
futures contract or make any other type of investment decision. It's not recommended to use any single indicator as sole evaluation criteria. The companies
and services listed on this website are not to be considered a recommendation
and it is the reader's responsibility to evaluate any product, service, or
company. patternsmart is not responsible for the accuracy or content of any
product, service or company linked to on this website.
Futures trading
contains substantial risk and is not for every investor.Please read the following risk disclosure before considering the
trading of this product:
Futures Risk Disclosure. An investor could
potentially lose all or more than the initial investment. Risk capital is money
that can be lost without jeopardizing ones financial security or life style.
Only risk capital should be used for trading and only those with sufficient risk
capital should consider trading. Past performance is not necessarily indicative
of future results.
Trading stocks, options, futures and forex involves
speculation, and the risk of loss can be substantial.Investor must consider all
relevant risk factors, including their own personal financial situation, before
trading. Trading foreign exchange on margin carries a high level of risk, as
well as its own unique risk factors. Forex investments are subject to
counter-party risk, as there is no central clearing organization for these
transactions. Please read the following risk disclosure before considering the
trading of this product:
Forex Risk Disclosure. Spreads, Straddles, and other multiple-leg option
strategies can entail substantial transaction costs, including multiple
commissions, which may impact any potential return. Options are not suitable for
all investors as the special risks inherent to options trading may expose
investors to potentially rapid and substantial losses. Prior to trading options,
you should carefully read
Characteristics and Risks of Standardized Options.
patternsmart.com
will not be held liable for the loss of money or any damage caused from relying
on the information on this site. Any investment decision you make in your account is solely your responsibility.
TESTIMONIAL DISCLOSURE: TESTIMONIALS APPEARING ON OUR SITE MAY NOT BE REPRESENTATIVE OF THE EXPERIENCE OF OTHER CLIENTS OR CUSTOMERS AND IS NOT A GUARANTEE OF FUTURE PERFORMANCE OR SUCCESS.





 (
(