Your shopping cart is empty!
Shopping Cart
0 item(s) - FreeCustomization and Conversion for: MetaTrader(MT4, MT5), Thinkorswim, NinjaTrader, MultiCharts, Tradingview, Prorealtime, SierraChart, etc.
License renew price will be 20% off for the 2nd year and after.
Featured
Bearish XABCD 5-point W shape chart pattern indicator for NinjaTrader 8.


") (
(Please note that this purchase is a 1-Year license. About License renew.
These indicators are designed for use by professionals only.
Please make sure you understand the mechanism before making a purchase.
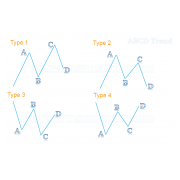
XABCD 5-point chart patterns are very common and popular in technical analysis, some of them have already been named, such as Gartley, Butterfly, Bat, Crab, Shark and Cypher.
As the name suggests, the XABCD pattern has 5 points and 4 legs formed by those 5 points. The concept of XABCD 5-point pattern is to compare the retracement level between legs. For example, when you see AB makes a 0.382 or 38.2% Fibonacci retracement of the X-A leg or XA, it means that the price difference from point A to B is equal to 38.2% of the price difference from point X to A.
If we use a formula to represent the relation, it will be: (B-A)=0.382*(X-A);
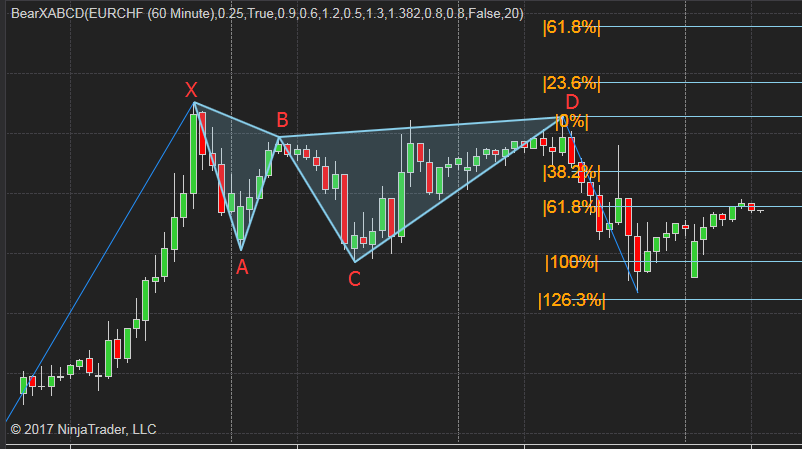
This indicator is able to detect and highlight any Bearish W shape XABCD 5-point chart pattern based on your pre-defined settings, and plots the Fibonacci retracement automatically.
The following video shows how it plots in real-time.
How it works:
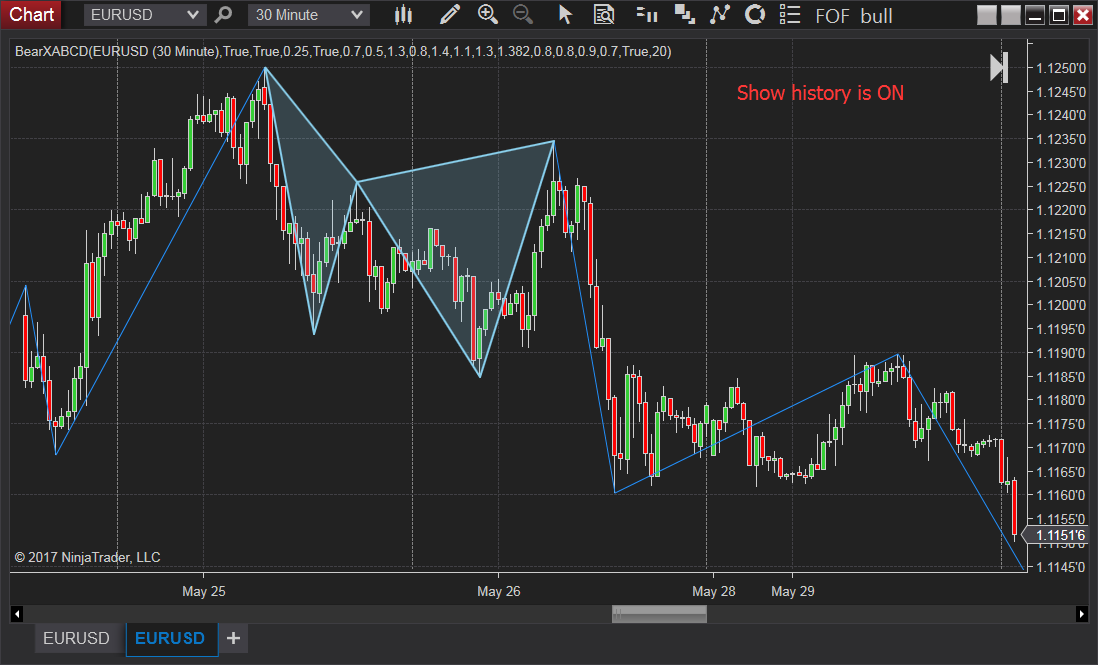
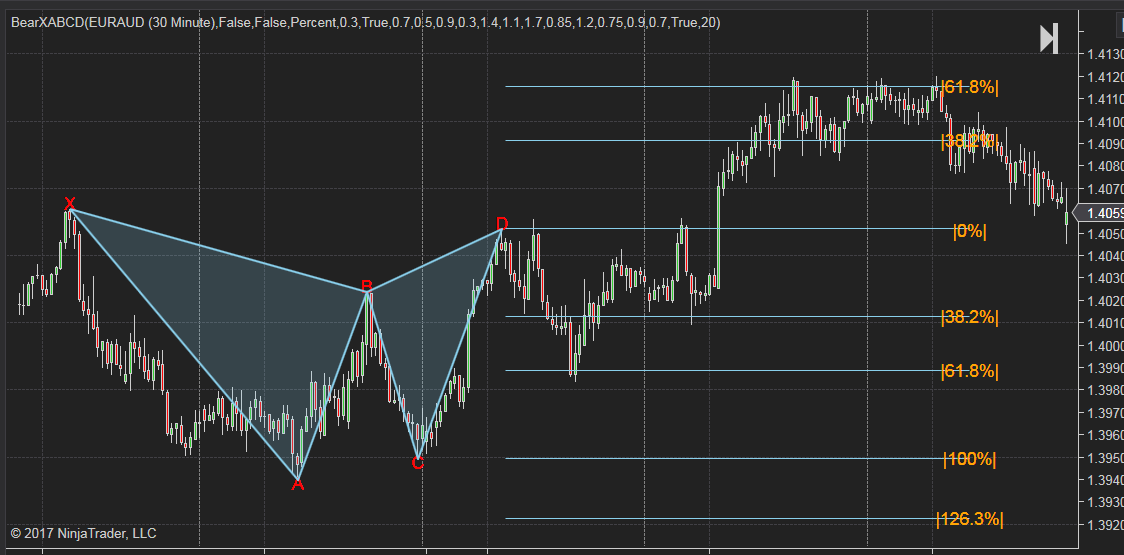
It uses Zigzag to track the price trend and detect all four legs based on your settings. If there are four adjacent legs that meet the retracement levels you set, it will highlight the XABCD 5 points, plot two triangles and draw the Fibonacci retracement lines. The image below is an example of what this indicator plots on the chart.
There are two Zigzag deviation type: percentage and point. The parameter "deviation value" is the actual number used for deviation type.
When you use percentage as the deviation type, it means that the value difference between two adjacent Zigzag point must be greater than the input percentage which is the deviation value. For example, if you used percentage deviation type and set the deviation value to 0.1, the value difference between X and A must greater than 0.1%. It also applies to all adjacent Zigzag points such as: A and B, B and C, C and D.
When you use point as the deviation type, it means that the value difference between two adjacent Zigzag point must be greater than the input point which is the deviation value. The value of the Point is the actual price amount, if you set the deviation value to 1 the value difference between X and A must greater than $1. It also applies to all adjacent Zigzag points such as: A and B, B and C, C and D.
For example, if you used a percentage deviation type and set the deviation value to 0.1, the value difference between X and A must greater than $0.1.
Please make sure you set the proper input for zigzag, otherwise you may not be able to detect the desired patterns.
You may need to use a relatively small deviation value for Forex.
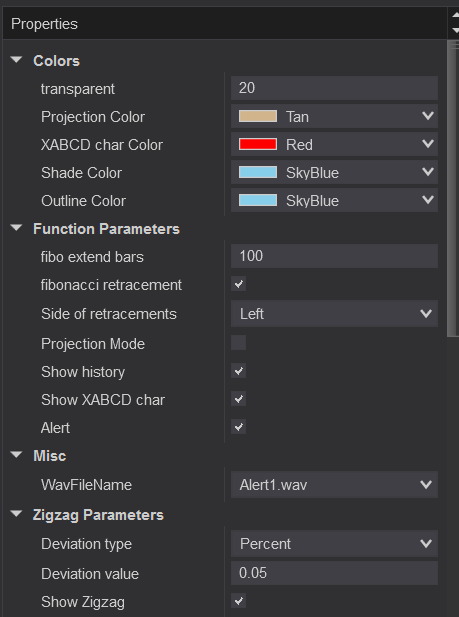
Features:
- Automatically highlight the XABCD 5 points pattern and shade the triangle XAB and BCD.
- You will be able to change the outline color for those 4 legs, XA, AB, BC and CD.
- You will be able to change the shade color and transparent level of the two triangles XAB and BCD.
- Automatically draw Fibonacci retracement levels with ON/OFF switch,
- adjust how many bars used for the extension of fibo levels.
- Select Right or Left side to show the fibo values.
- Plot a projection (not prediction) of the D point when XABC is confirmed.
- Enable to turn this feature ON/OFF.
- If the actual D point is detected, the projection will be removed.
- Show XABCD patterns on history data, if turn this feature OFF, it will only plot the last one XABCD pattern.
- Sound alert whenever a XABCD pattern is detected.
- Select different alert sound files with drop down menu.
- Adjust the Zigzag parameters:
- Zigzag deviation type: percentage or point
- Zigzag deviation value.
- Switch ON/OFF to show Zigzag line.
The retracement levels in some XABCD patterns definition are theoretical values, it's not realistic to set the retracement as a fixed value such as 0.618, since you may not be able to find any pattern in a short time.
It's better to set the value as a range. For example, if you want to detect 0.618 retracement from AB to XA, then set a range from 0.6 to 0.64 will be more practical.
Set the inputs as: ratio AB:XA <=0.6 and ratio AB:XA >=0.64.
Define the retracement between legs as shown in the picture below.
- If you want to compare BC and XA instead of BC and AB then enable BC:XA, it will disable BC:AB automatically. Same for CD:XC.

Show XABCD patterns on history data, if turn this feature OFF, it will only plot the latest XABCD pattern.
Otherwise, it will keep all qualified patterns on the chart.
But only the last one will show Fibonacci retracement levels.
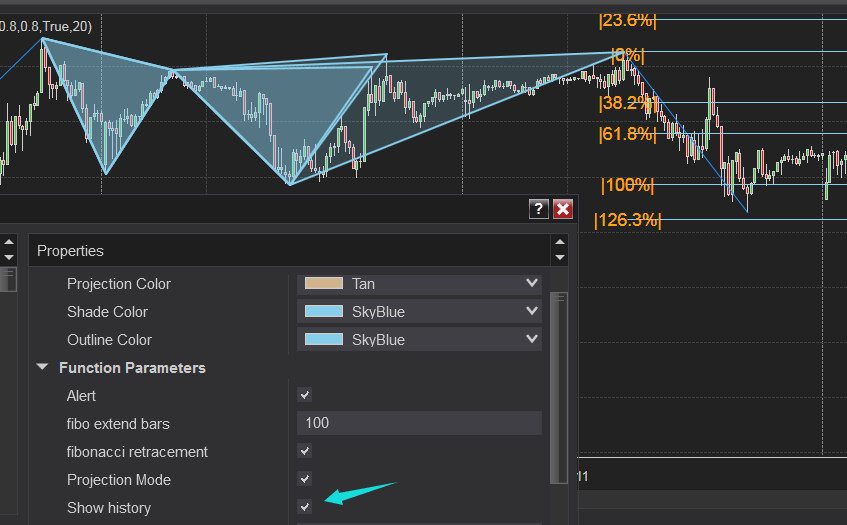
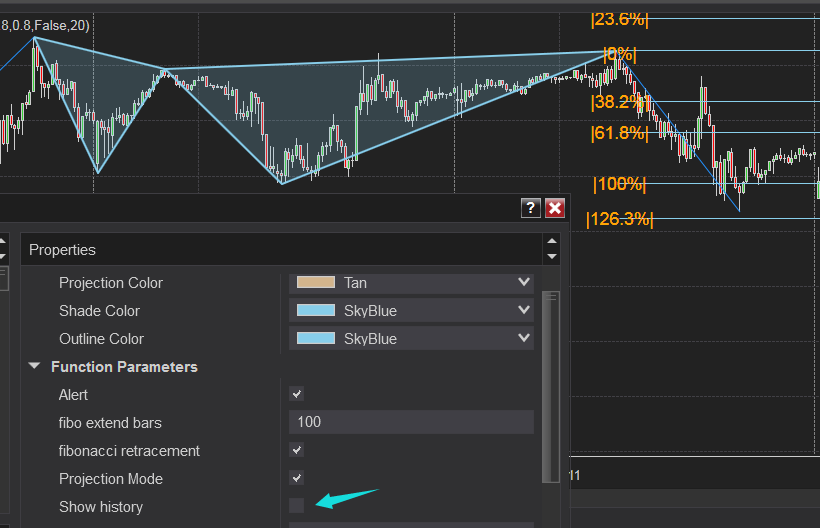
The following chart is a pattern on history data.
The following chart is an example of how projection mode works.
It will draw the point D once point C is formed, the shade color is orange instead of light blue.

The following chart is an example of how customized XABCD ratio works.
You can set the ratios to any value you want.
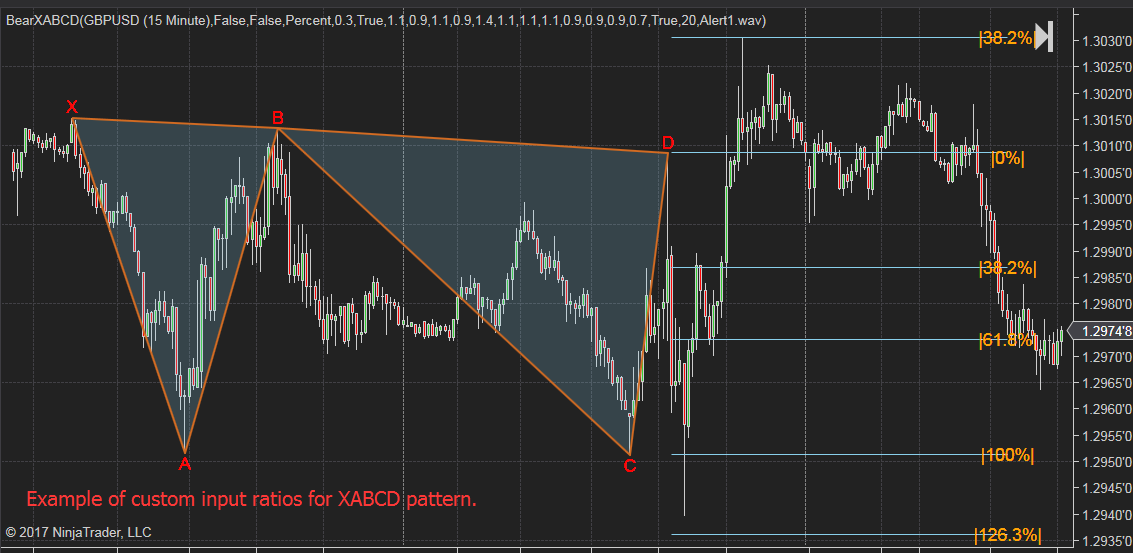
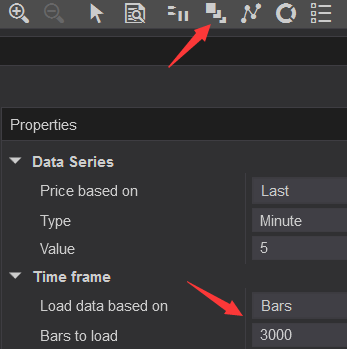
Please make sure you have enough bars loaded on the chart.
You can also use this indicator to capture any XABCD pattern as well as the ones that already been named.
The following example shows how to use this indicator to detect Cypher Pattern.
Cypher Pattern Rules:
- The Cypher pattern starts with the X and A point.
- Point B is confirmed when AB retraces to 0.382 – 0.618 Fibonacci level of the leg XA
- Point C is confirmed when BC extends the XA leg by at least 1.272 or within 1.130 – 1.414 Fibonacci extension level
- Point D is confirmed when CD retraces 0.782 Fibonacci level of XC
The image below is the parameters for Cypher Pattern, since it uses BC:XA and CD:XC, you need to enable those settings.
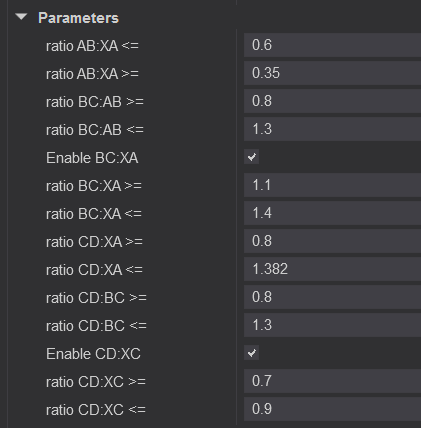
By applying the inputs above, the indicator will be able to detect Cypher pattern as shown in below.

The following example shows how to use this indicator to detect Gartley pattern.
Gartley pattern rules:
- Leg AB should be the .618 retracement of leg XA.
- Point C is confirmed when BC retraces either .382 or .886 of AB.
- If the retracement of BC is .382 of AB, then CD should be 1.272 of BC. If BC is .886 of AB, then CD should extend 1.618 of BC.
- CD should be .786 retracement of XA.
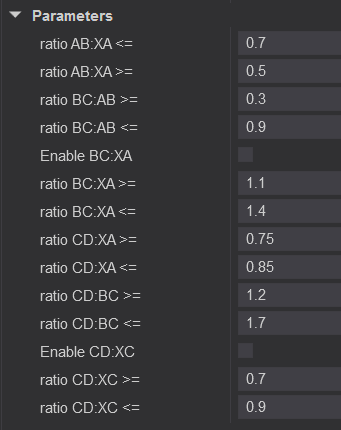
By applying the inputs above, the indicator will be able to detect the Gartley pattern as shown in below.
Since the legs are based on Zigzag line, please make sure you set the proper input for zigzag first, otherwise you may not be able to detect the desired patterns.
Write a review
Your Name:Your Review: Note: HTML is not translated!
Rating: Bad Good
Enter the code in the box below:


-80x80.png)

Latest


Welcome to Patternsmart
Converting your indicator from one platform to another.Custom Alert, Autotrader, Indicators, Scan, Screener, Strategy and Signals.
Copyright @ 2023 Patternsmart - All rights reserved
This website is for educational and informational
purposes only and should not be considered a solicitation to buy or sell a
futures contract or make any other type of investment decision. It's not recommended to use any single indicator as sole evaluation criteria. The companies
and services listed on this website are not to be considered a recommendation
and it is the reader's responsibility to evaluate any product, service, or
company. patternsmart is not responsible for the accuracy or content of any
product, service or company linked to on this website.
Futures trading
contains substantial risk and is not for every investor.Please read the following risk disclosure before considering the
trading of this product:
Futures Risk Disclosure. An investor could
potentially lose all or more than the initial investment. Risk capital is money
that can be lost without jeopardizing ones financial security or life style.
Only risk capital should be used for trading and only those with sufficient risk
capital should consider trading. Past performance is not necessarily indicative
of future results.
Trading stocks, options, futures and forex involves
speculation, and the risk of loss can be substantial.Investor must consider all
relevant risk factors, including their own personal financial situation, before
trading. Trading foreign exchange on margin carries a high level of risk, as
well as its own unique risk factors. Forex investments are subject to
counter-party risk, as there is no central clearing organization for these
transactions. Please read the following risk disclosure before considering the
trading of this product:
Forex Risk Disclosure. Spreads, Straddles, and other multiple-leg option
strategies can entail substantial transaction costs, including multiple
commissions, which may impact any potential return. Options are not suitable for
all investors as the special risks inherent to options trading may expose
investors to potentially rapid and substantial losses. Prior to trading options,
you should carefully read
Characteristics and Risks of Standardized Options.
patternsmart.com
will not be held liable for the loss of money or any damage caused from relying
on the information on this site. Any investment decision you make in your account is solely your responsibility.
TESTIMONIAL DISCLOSURE: TESTIMONIALS APPEARING ON OUR SITE MAY NOT BE REPRESENTATIVE OF THE EXPERIENCE OF OTHER CLIENTS OR CUSTOMERS AND IS NOT A GUARANTEE OF FUTURE PERFORMANCE OR SUCCESS.