Your shopping cart is empty!
Shopping Cart
0 item(s) - FreeCustomization and Conversion for: MetaTrader(MT4, MT5), Thinkorswim, NinjaTrader, MultiCharts, Tradingview, Prorealtime, SierraChart, etc.
License renew price will be 20% off for the 2nd year and after.
Featured

Auto Swing high low Fibonacci Channel indicator for MultiCharts 1 Year license

") (
(This purchase is a 1-Year license. About License renew.
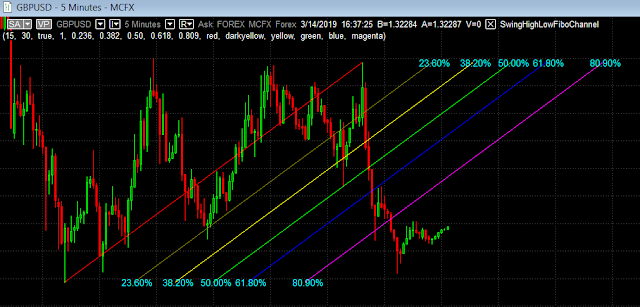
This MultiCharts indicator is able to draw the Fibonacci Channel based on most recent Swing high & low automatically on the chart.
The lines of a Fibonacci Channel used Fibonacci ratios determined by the Fibonacci series, typically 23.6 percent, 38.2 percent, 50 percent, 61.8 percent and 80.9 percent. They can be used to estimate support and resistance levels.
How does it work?
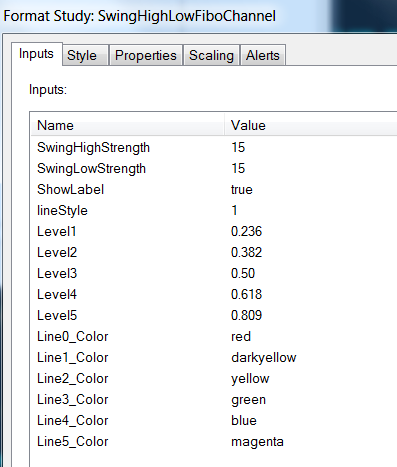
Features and inputs:

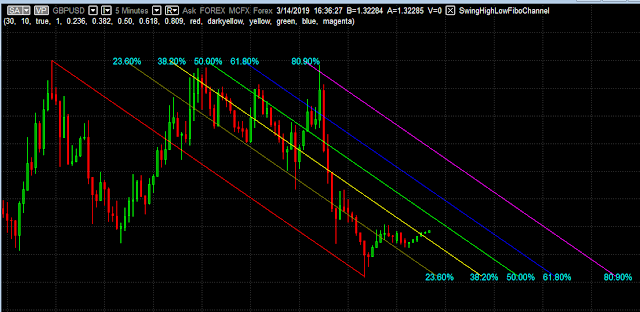
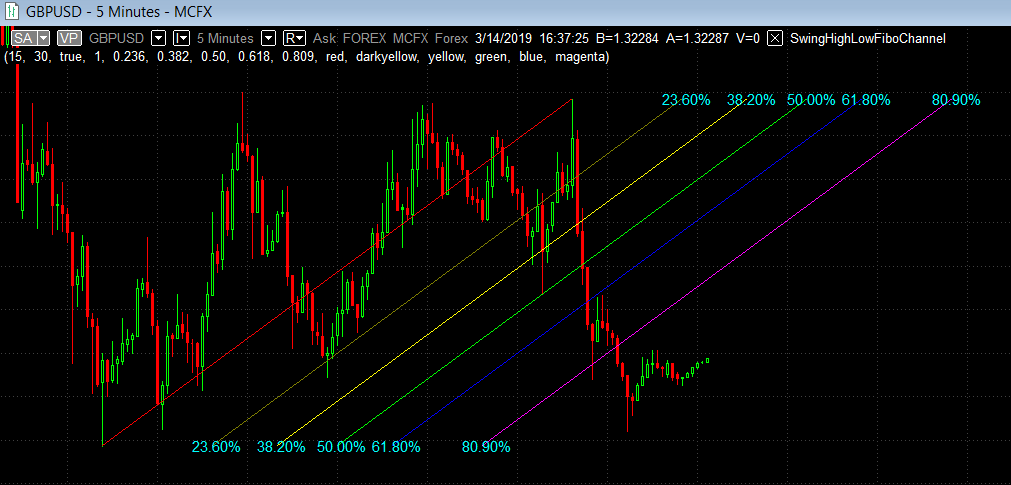
If there is not enough space on the right side of the chart, you may encounter a situation as shown in the image above, the Fibonacci Channel may look like squeezed. All you need to do is drag the indicator along with the price bars to the left side.
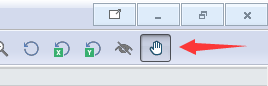
You can do this by selecting the "hand" icon on the top right of the MultiCharts toolstrip.
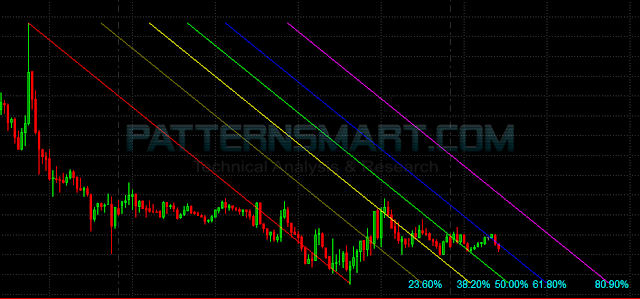
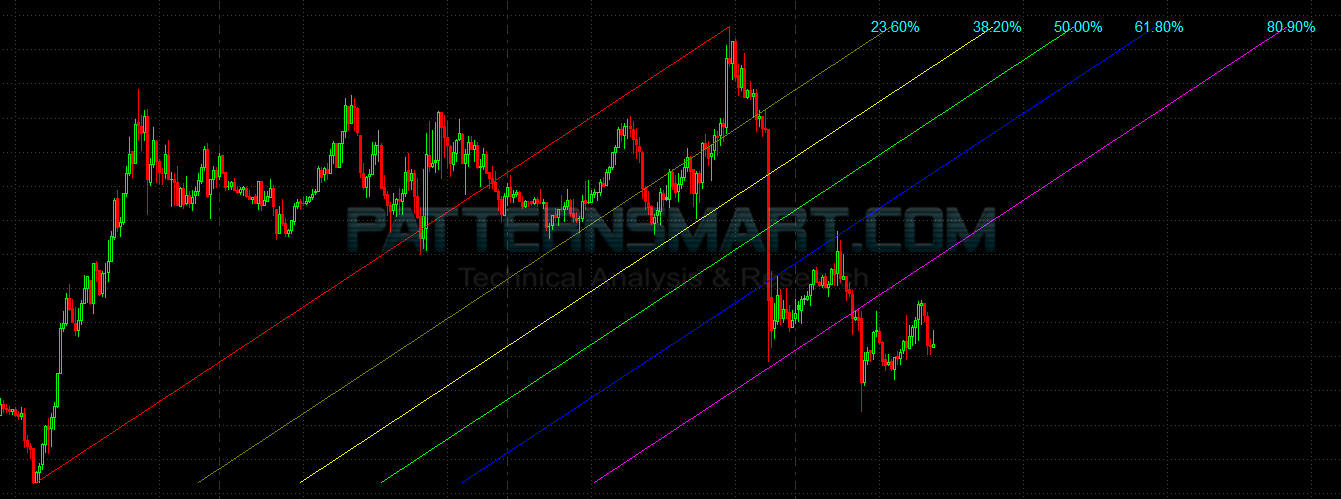
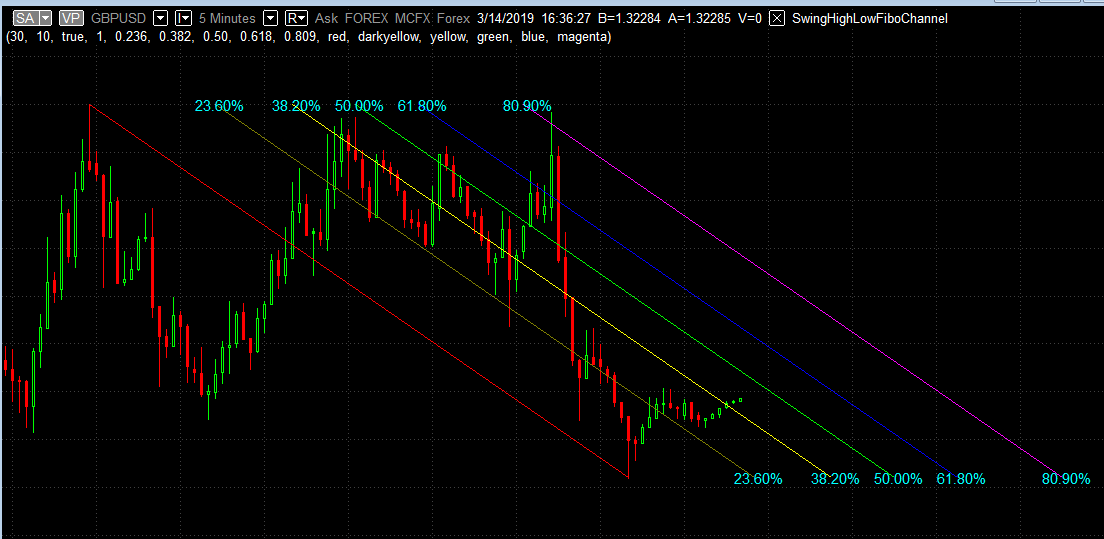
The Fibonacci Channel will become normal as shown in the image below after there is enough space on its right side.
This Fibonacci Channel indicator works on all timeframes
Click an image to view at full size.

This MultiCharts indicator is able to draw the Fibonacci Channel based on most recent Swing high & low automatically on the chart.
The lines of a Fibonacci Channel used Fibonacci ratios determined by the Fibonacci series, typically 23.6 percent, 38.2 percent, 50 percent, 61.8 percent and 80.9 percent. They can be used to estimate support and resistance levels.
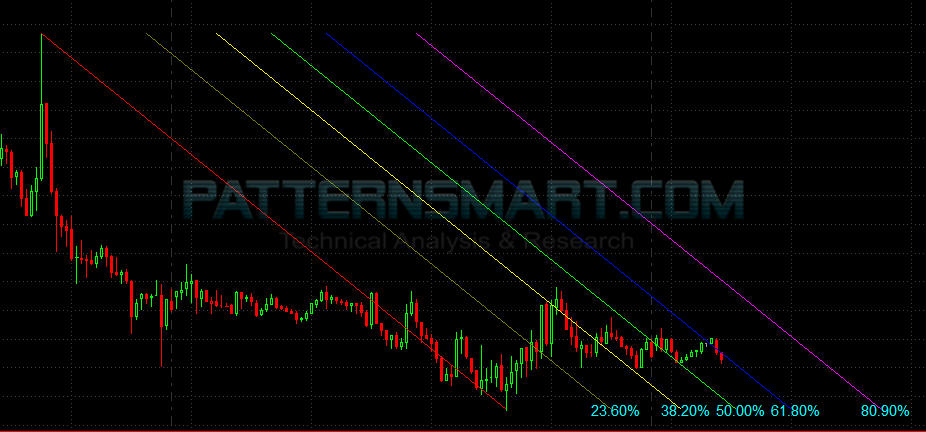
Fibonacci Channel is a practical technique that uses Fibonacci ratios to draw out levels of support and resistance, it is a variation of the Fibonacci retracement pattern, with the trend lines running diagonally rather than horizontally. It can be applied to both short-term and long-term trends, as well as to up and downtrends. See chart below for an example.
As the chart below shows, the Channels can be either upwards (rising Fibonacci Channel) or downwards (Falling Fibonacci Channel), and the lines are drawn using Fibonacci ratios, typically 23.6%, 38.2%, 50%, 61.8% and 80.9%.
Click an image to view at full size.

How does it work?
It helps to identify potential support/resistance as price moves towards to or along the Fibonacci Channel.
- Strength, it's the number of bars used to detect the highest and lowest price.
If Strength set to 5, it means the swing high must be greater than the highs
of at least 5 bars to its left side and at least 5 bars to its right side. It can be more than 5 bars to each side of the swing point, but it cannot be less than 5.
For more info about the swing point, please check: https://patternsmart.blogspot.com/2018/08/what-is-swing-point-swing-high-and.html
- If you want to use different ratios other than the default ones, you can change them from input Level1 to Level4.
- You can change the color of each level line, the Line1 is the bottom one and Line6 is the top one. Please use the following available colors: Black Blue Cyan DarkBlue DarkBrown DarkCyan DarkGray DarkGreen DarkMagenta DarkRed DarkYellow Green LightGray Magenta Red White Yellow
- The highest and lowest level are auto-detected and can't be changed.
- Line style: you can enter from 1 to 5.
1 is Solid like this: ______________________
2 is Dashed - - - - - - - - - - - - - - - - - - -
3 is Dashed ............................................
4 is Dashed2 __ _ __ _ __ _ __ _ __ _ __
5 is Dashed3 ___ _ _ ___ _ _ ___ _ _ ___
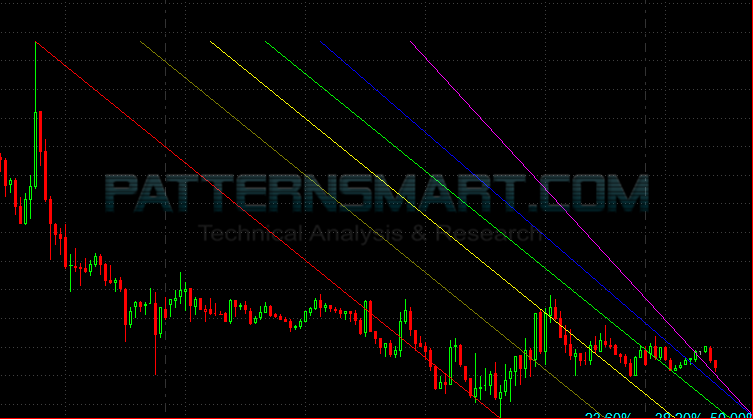
If there is not enough space on the right side of the chart, you may encounter a situation as shown in the image above, the Fibonacci Channel may look like squeezed. All you need to do is drag the indicator along with the price bars to the left side.
You can do this by selecting the "hand" icon on the top right of the MultiCharts toolstrip.
The Fibonacci Channel will become normal as shown in the image below after there is enough space on its right side.
This Fibonacci Channel indicator works on all timeframes
Click an image to view at full size.
Write a review
Your Name:Your Review: Note: HTML is not translated!
Rating: Bad Good
Enter the code in the box below:


Latest


Welcome to Patternsmart
Converting your indicator from one platform to another.Custom Alert, Autotrader, Indicators, Scan, Screener, Strategy and Signals.
Copyright @ 2023 Patternsmart - All rights reserved
This website is for educational and informational
purposes only and should not be considered a solicitation to buy or sell a
futures contract or make any other type of investment decision. It's not recommended to use any single indicator as sole evaluation criteria. The companies
and services listed on this website are not to be considered a recommendation
and it is the reader's responsibility to evaluate any product, service, or
company. patternsmart is not responsible for the accuracy or content of any
product, service or company linked to on this website.
Futures trading
contains substantial risk and is not for every investor.Please read the following risk disclosure before considering the
trading of this product:
Futures Risk Disclosure. An investor could
potentially lose all or more than the initial investment. Risk capital is money
that can be lost without jeopardizing ones financial security or life style.
Only risk capital should be used for trading and only those with sufficient risk
capital should consider trading. Past performance is not necessarily indicative
of future results.
Trading stocks, options, futures and forex involves
speculation, and the risk of loss can be substantial.Investor must consider all
relevant risk factors, including their own personal financial situation, before
trading. Trading foreign exchange on margin carries a high level of risk, as
well as its own unique risk factors. Forex investments are subject to
counter-party risk, as there is no central clearing organization for these
transactions. Please read the following risk disclosure before considering the
trading of this product:
Forex Risk Disclosure. Spreads, Straddles, and other multiple-leg option
strategies can entail substantial transaction costs, including multiple
commissions, which may impact any potential return. Options are not suitable for
all investors as the special risks inherent to options trading may expose
investors to potentially rapid and substantial losses. Prior to trading options,
you should carefully read
Characteristics and Risks of Standardized Options.
patternsmart.com
will not be held liable for the loss of money or any damage caused from relying
on the information on this site. Any investment decision you make in your account is solely your responsibility.
TESTIMONIAL DISCLOSURE: TESTIMONIALS APPEARING ON OUR SITE MAY NOT BE REPRESENTATIVE OF THE EXPERIENCE OF OTHER CLIENTS OR CUSTOMERS AND IS NOT A GUARANTEE OF FUTURE PERFORMANCE OR SUCCESS.