Popular tags: Support, Resistance, Trend, Range, Fibonacci, Wave, Divergence, Multi time frames(MTF), Swing, Volume, Overbought, Oversold
Customization and Conversion for: MetaTrader(MT4, MT5), Thinkorswim, NinjaTrader, MultiCharts, Tradingview, Prorealtime, SierraChart, etc.
License renew price will be 20% off for the 2nd year and after.


3 Level ZigZag Session High Low Indicator Tick Size version for Thinkorswim TOS

3 Level ZigZag Session High Low Indicator Tick Size version for Thinkorswim TOS
3 Level ZigZag Session High Low Indicator Tick Size version for Thinkorswim TOS 3 Level ZigZag Session High Low Indicator Tick Size version for Thinkorswim TOS 3 Level ZigZag Session High Low Indicator Tick Size version for Thinkorswim TOS 3 Level ZigZag Session High Low Indicator Tick Size version for Thinkorswim TOS 3 Level ZigZag Session High Low Indicator Tick Size version for Thinkorswim TOS 3 Level ZigZag Session High Low Indicator Tick Size version for Thinkorswim TOS 3 Level ZigZag Session High Low Indicator Tick Size version for Thinkorswim TOS 3 Level ZigZag Session High Low Indicator Tick Size version for Thinkorswim TOS 3 Level ZigZag Session High Low Indicator Tick Size version for Thinkorswim TOS
Availability: In Stock
Price: $199.00USD $149.00USD
Qty:     - OR -   Add to Wish List
Add to Compare
0 (0/5)  0 reviews  |  Write a review

3 Level ZigZag Session High Low Indicator for Thinkorswim TOS
VIP member get 10% off, click here to become a VIP member.


The Zigzag indicator is a unique and highly useful tool in technical analysis, but it's often misunderstood. Its primary value isn't in generating buy/sell signals like a typical oscillator (e.g., RSI or Stochastic). Instead, its power lies in filtering out market noise and providing clarity.

Here’s a breakdown of why it's useful, complete with practical examples.

1. It Filters Out Noise and Identifies Significant Trends

This is its core function. Financial charts are full of minor, insignificant price movements that can distract and lead to poor decisions (often called "noise").

  • What it does: The Zigzag indicator only plots a line when a price movement exceeds a certain percentage (e.g., 5%) or number of points. It ignores all smaller fluctuations.

  • Why it's useful: This allows you to see the true underlying structure of the market. You can instantly identify the most important highs (swing highs) and lows (swing lows) without the distraction of minor pullbacks and bounces.


2. It Helps in Visualizing and Identifying Chart Patterns

Classic chart patterns (like Head & Shoulders, Double Tops/Bottoms, Triangles, and Flags) are foundational to technical analysis. They are often hard to spot in real-time due to market noise.

  • What it does: By connecting significant highs and lows, the Zigzag indicator "traces" the outline of these patterns for you.

  • Why it's useful: It makes pattern recognition significantly easier, allowing you to anticipate potential breakouts or breakdowns and manage your trades accordingly.

Example:
A "Head and Shoulders" pattern becomes unmistakable when the Zigzag line clearly forms a central peak (head) between two lower peaks (shoulders).


3. It is Essential for Advanced Elliott Wave Analysis

Elliott Wave Theory is a complex form of technical analysis that proposes that market prices move in repetitive wave cycles. Practitioners of this theory rely heavily on the Zigzag indicator.

  • Why it's useful: Without a tool like Zigzag, counting waves on a raw price chart is extremely subjective and difficult. The indicator provides a cleaner, objective framework for wave counting.


4. It Provides Clear Support and Resistance Levels

The swing highs and swing lows identified by the Zigzag indicator are not just arbitrary points; they represent key moments where the market sentiment shifted.

  • Why it's useful: These levels become dynamic areas of support (previous swing lows) and resistance (previous swing highs). Traders watch these levels for potential bounce or breakout entries.


5. It Forms the Basis for Fibonacci Retracement Tools

Most trading platforms require you to manually select a significant swing low and a significant swing high to draw Fibonacci retracement levels.

  • What it does: The Zigzag indicator objectively shows you which swing points are the most relevant to use.

  • Why it's useful: It removes the guesswork. You can quickly and accurately draw your Fib tool from a clear Zigzag low to a clear Zigzag high, ensuring your retracement levels are based on meaningful price movements.

Crucial Limitations and Warnings (You MUST Know This)

The Zigzag indicator is powerful, but it has a major drawback that beginners often miss:

  • It Repaints (or Lags): This is the most important point. The Zigzag line is not drawn in real-time. It only appears after the price movement has already occurred and met the minimum percentage change criteria. A line that appears to be predicting a turn might actually change or disappear as new price data comes in.

    • You cannot use it for predictive signals. It is a historical analysis tool. Its value is in analyzing past price action to make informed decisions about the future, not in telling you what will happen in the next candle.

Summary: How Traders Use It Effectively

A smart trader doesn't wait for the Zigzag to "give a signal." They use it as a lens to clean up their chart and then apply other techniques:

  1. Spot a Pattern: Use the Zigzag to clearly see a Double Top forming.

  2. Identify Key Level: Note that the neckline of the pattern is at a prior Zigzag low.

  3. Wait for Confirmation: Use a real-time indicator (like a break of that neckline on high volume or a momentum divergence on the RSI) to generate an actual entry signal.

  4. Manage the Trade: Place a stop-loss above the most recent Zigzag high (for a short trade) and take profit at the next major support level identified by a previous Zigzag low.

In conclusion, the Zigzag indicator is most useful as a filtering and analytical tool, not a signal generator. It helps traders see the forest for the trees by removing noise, clarifying trends, highlighting patterns, and identifying critical support and resistance levels. Just always remember its lagging nature and use it in conjunction with other confirming indicators.


This indicator is best used to highlight important chart patterns and confirm possible trend reversals.

The tick size version will use the given number of ticks to check the reverse level instead of percentage, that's the main difference between this version and the regular version.


The calculation is based on ZigZag algorithm.
ZigZag plot connects swing points if the difference between their prices exceeds a specified value which is equal to pre-defined ticks of price change plus Average True Range (ATR) multiplied by a factor.

Note that the last segment of the plot can change its direction drastically as a considerable future market move might occur. (source: Thinkorswim)
Please make sure you understand the mechanism of zigzag before purchase this indicator.

Features:

  1. Three user-defined periods which is used to calculate the ATR value
  2. Three user-defined ticksize used to check the reverse level, respectively.
  3. There are three different arrow sizes, small, medium and large.
  4. Three alerts, when a signal is triggered, you will get a sound alert message.
  5. Three different sizes arrows for both upward and downward. You can also change them to other sharps.
  6. Six different colors for each of the arrows.

How to use:

if you use this indicator on a 5-minute chart and have the following settings:
ticksize1=15;
ticksize2=30;
ticksize3=50;
period1=5;
period2=15;
period3=30;

You may get a similar chart as shown below:

small arrow (A1, A2) corresponds to input ticksize1 and period1;
medium arrow (B1, B2) corresponds to input ticksize2 and period2;
large arrow (C1, C2) corresponds to input ticksize3 and period3;


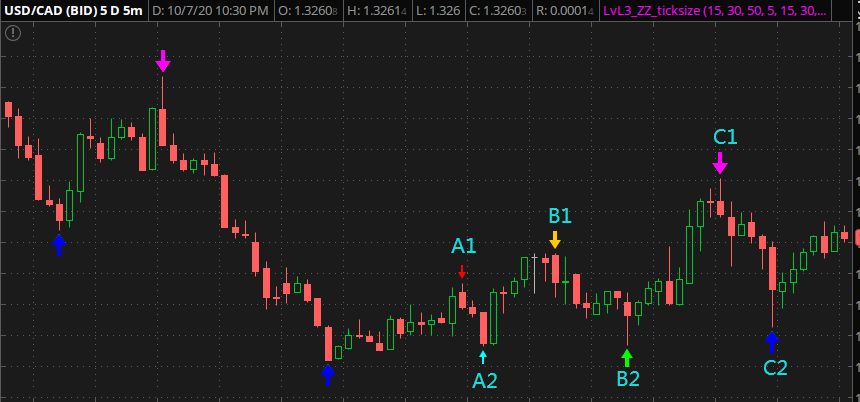
The indicator will plot the arrow whenever the reversal hit the target, for example, the related reverse target of A1 and A2 are calculated based on 15(ticksize1) ticks plus ATR reverse value of 5 (period1). The price difference between A1 and A2 is at least 15 ticks, but it's less than 30 ticks (ticksize2), that's why it only shows a small arrow at A2.

From A2 to B1, the price went up more than 30 ticks (ticksize2), but less than 50 ticks (ticksize3), so a medium arrow will be shown at B1.

The price went up from B2 to C1 for more than 50 ticks (ticksize3), and dropped for more than 50 ticks from C1 to C2, so it will plot big arrows at C1 and C2.


Please make sure the ticksize inputs are properly set for your chart.


It works on any time frame(Tick, Minutes, Daily, Weekly, Monthly) and all markets(Stocks, Futures, Forex, Options, ETF, etc.)
 

If you want to add any feature to this indicator, please send us a Customization request.


Write a review

Your Name:


Your Review: Note: HTML is not translated!

Rating: Bad           Good

Enter the code in the box below:


Welcome to Patternsmart
Converting your indicator from one platform to another.

Custom Alert, Autotrader, Indicators, Scan, Screener, Strategy and Signals.


Copyright @ 2025 Patternsmart - All rights reserved


This website is for educational and informational purposes only and should not be considered a solicitation to buy or sell a futures contract or make any other type of investment decision. It's not recommended to use any single indicator as sole evaluation criteria. The companies and services listed on this website are not to be considered a recommendation and it is the reader's responsibility to evaluate any product, service, or company. patternsmart is not responsible for the accuracy or content of any product, service or company linked to on this website.

Futures trading contains substantial risk and is not for every investor.Please read the following risk disclosure before considering the trading of this product: Futures Risk Disclosure. An investor could potentially lose all or more than the initial investment. Risk capital is money that can be lost without jeopardizing ones financial security or life style. Only risk capital should be used for trading and only those with sufficient risk capital should consider trading. Past performance is not necessarily indicative of future results.

Trading stocks, options, futures and forex involves speculation, and the risk of loss can be substantial.Investor must consider all relevant risk factors, including their own personal financial situation, before trading. Trading foreign exchange on margin carries a high level of risk, as well as its own unique risk factors. Forex investments are subject to counter-party risk, as there is no central clearing organization for these transactions. Please read the following risk disclosure before considering the trading of this product: Forex Risk Disclosure. Spreads, Straddles, and other multiple-leg option strategies can entail substantial transaction costs, including multiple commissions, which may impact any potential return. Options are not suitable for all investors as the special risks inherent to options trading may expose investors to potentially rapid and substantial losses. Prior to trading options, you should carefully read Characteristics and Risks of Standardized Options.

patternsmart.com will not be held liable for the loss of money or any damage caused from relying on the information on this site. Any investment decision you make in your account is solely your responsibility.
TESTIMONIAL DISCLOSURE: TESTIMONIALS APPEARING ON OUR SITE MAY NOT BE REPRESENTATIVE OF THE EXPERIENCE OF OTHER CLIENTS OR CUSTOMERS AND IS NOT A GUARANTEE OF FUTURE PERFORMANCE OR SUCCESS.