Your shopping cart is empty!
Shopping Cart
0 item(s) - FreeCustomization and Conversion for: MetaTrader(MT4, MT5), Thinkorswim, NinjaTrader, MultiCharts, Tradingview, Prorealtime, SierraChart, etc.
License renew price will be 20% off for the 2nd year and after.
Featured

Trend Pullback Reversal TPR indicator for MultiCharts Permanent access license

") (
(This purchase is a Permanent access license. About License renew.
Please note that this is for MultiCharts, not MultiCharts.NET
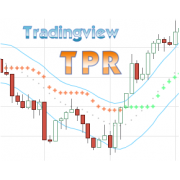
The TPR(Trend Pullback Reversal) indicator forms a possible price trend line and the trend line can be used as support & resistance level, it also provides Pullback and Reversal signals.
TPR works on all timeframes and all symbols and all type of bar chart.
TPR never repaints.
There are 4 Parameters:
- Period: number of bars used for calculations
- Factor: Multiplier factor, small number for short trend, large number for long trend
- ShowSignal: enable to show the signal dots
- ShowBand: enable to show band and center line
Click an image to view at full size.
We use the same algorithm for the TPR on all platforms, it will work exactly the same on any platform, you can also view some screenshot and videos we took from other platforms.
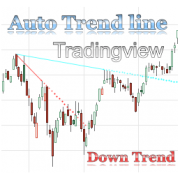
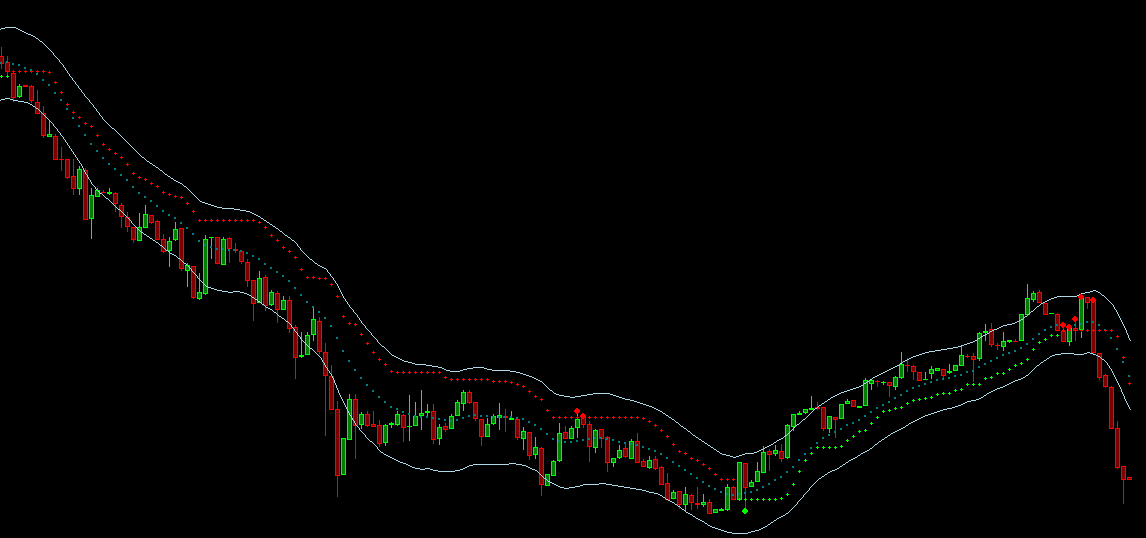
This is a video of how TPR indicator on NT8 performs in a relatively long-term downtrend of Forex AUDUSD 5min chart.
You may think it looks like supertrend or braintrend, right?
Actually, most trend indicators have a similar plot, the differences are where and when they give signals.
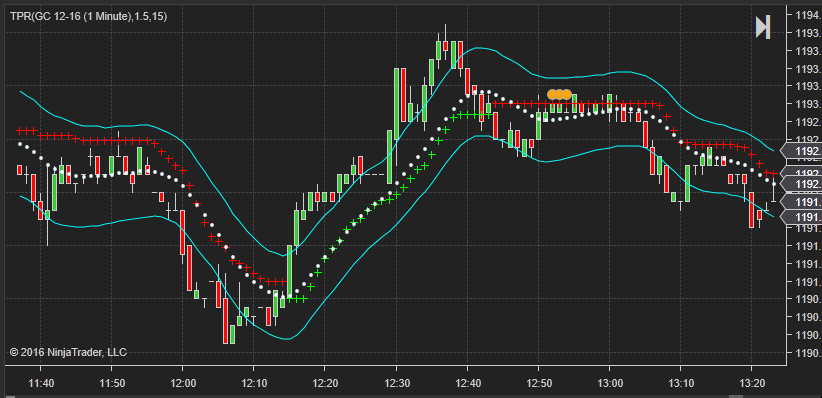
Unlike other trend indicators, TPR will focus on main trend and filter out most minor price movements. The green cross-line represents an uptrend, the red cross-line represents a downtrend and the blue dots are signals for possible reversals.
The additional band and center line may look like bollinger band, but the TPR band algorithm is completely different from bollingerband. There is no standard deviation in TPR band calculation.
The following image is a comparison of TPR and BOLL.
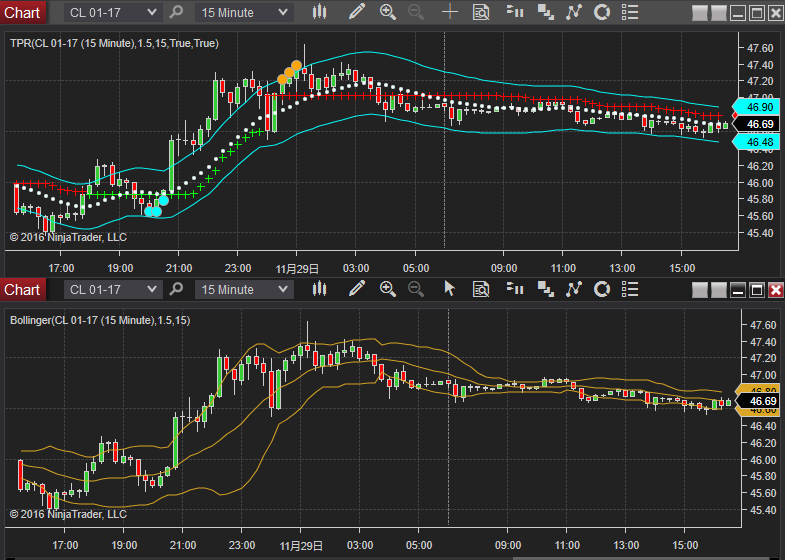
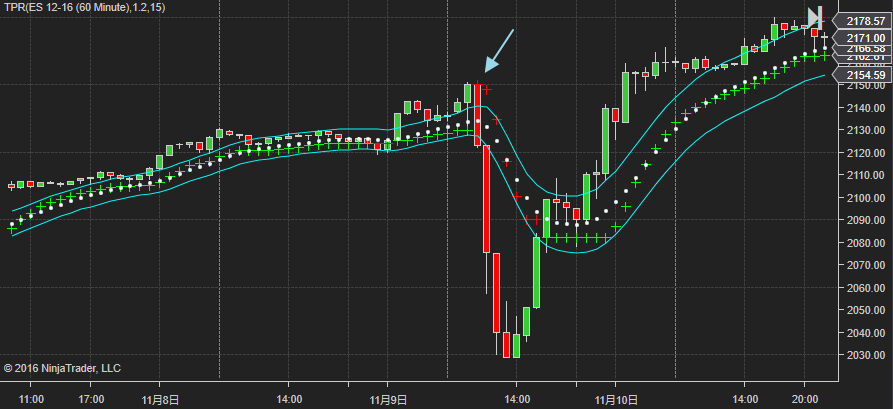
The TPR band gives a possible range of the TPR movement, if TPR is outside the band for many bars or far away from the band, it could be a sign of trend reversal.
The chart below is an example of TPR outside of band.
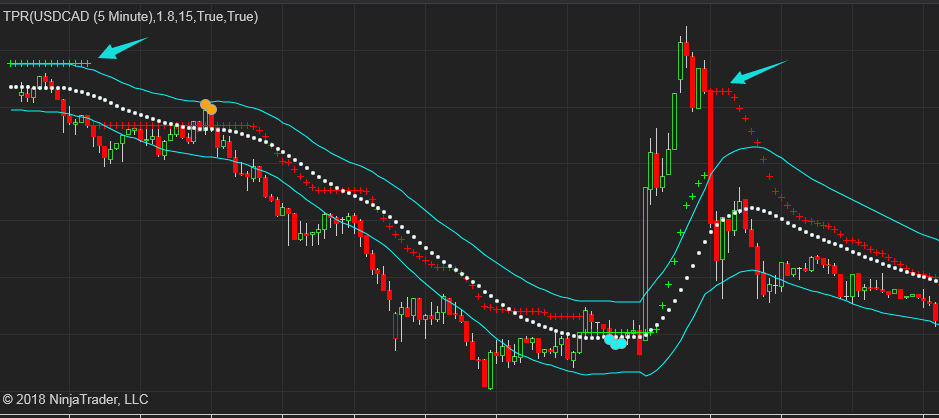
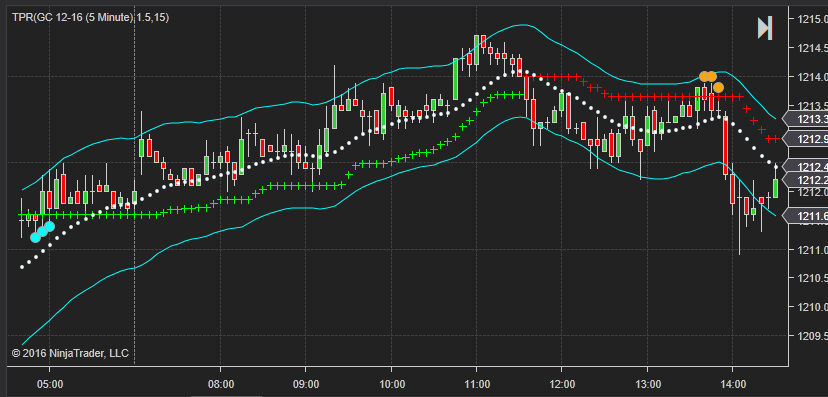
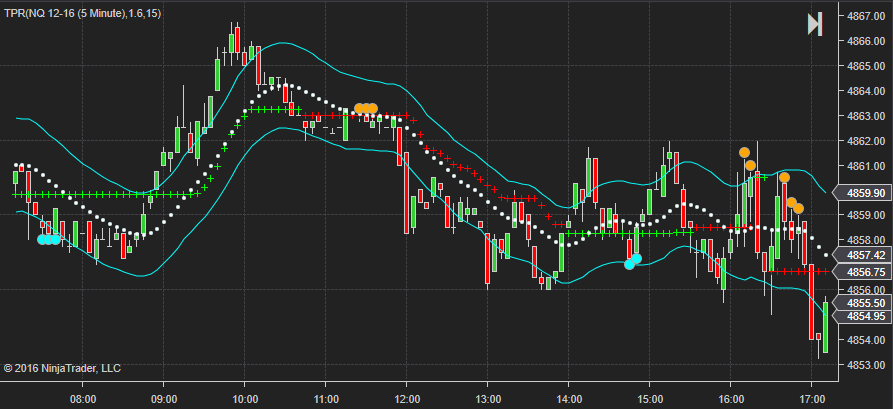
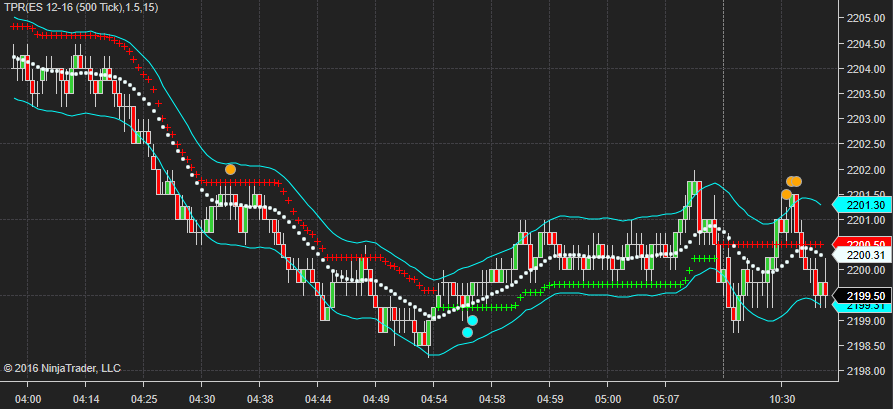
You can see how TPR reacts to price movement from the following images.
The orange and cyan dots give possible reversal signals.
|
|


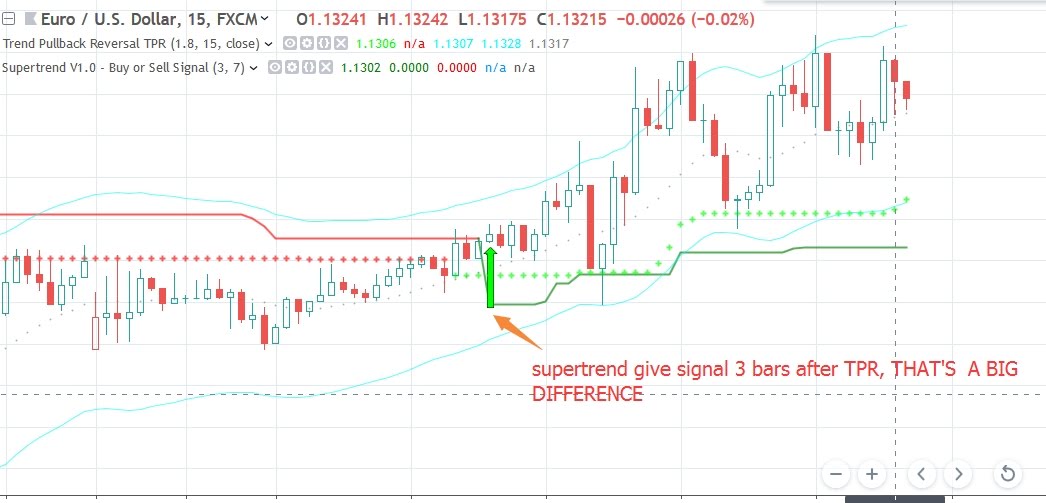
If you are familiar with the Supertrend indicator, you may think the TPR is almost the same as Supertrend. In this case, you should read the following content.
If only check the line plot from both Supertrend and TPR, it's easier to notice that TPR may change trend earlier than supertrend, as shown in the charts below, but that's not the main difference between them.
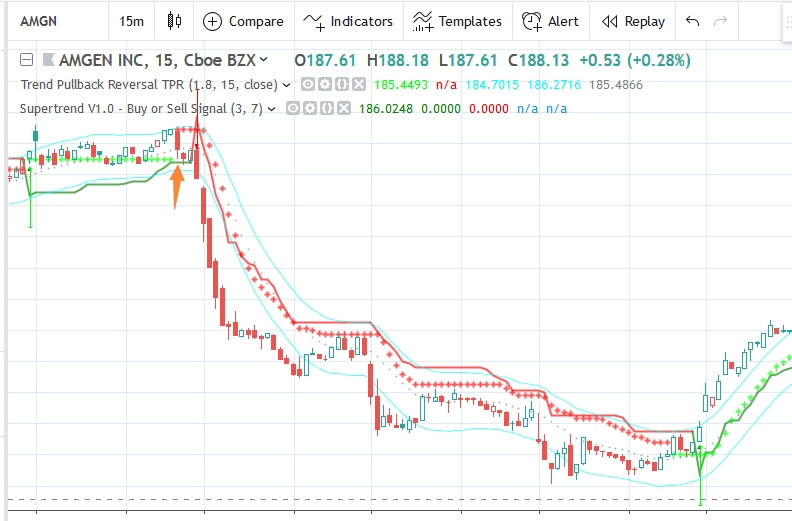
The most important difference between TPR and supertrend is that TPR can be used as a support and resistance indicator as well, not just a trend indicator.
The following 2 charts have both TPR and supertrend. The solid line is from supertrend, the cross line is TPR.
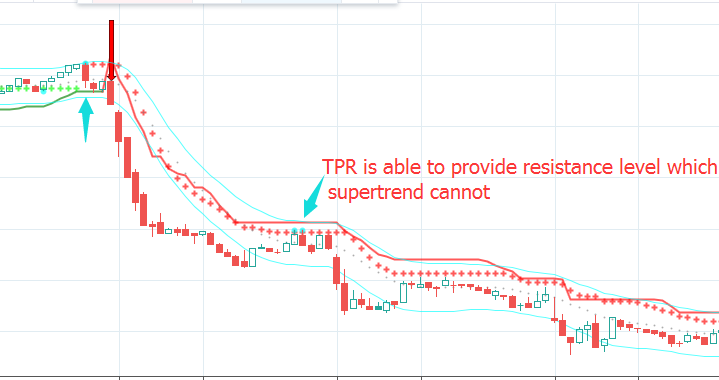
As you can see, the line from TPR provides a very good support and resistance level, but supertrend is far away from the price bar which cannot be used as support and resistance level at all.

In short, if you only need a trend indicator, both TPR and Supertrend will do the job.
But if you also want it to provide support and resistance level, TPR is much better than supertrend.
For more screenshots please visit: https://t.co/JQacXoMsNG
Write a review
Your Name:Your Review: Note: HTML is not translated!
Rating: Bad Good
Enter the code in the box below:


-80x80.png)
Latest


Welcome to Patternsmart
Converting your indicator from one platform to another.Custom Alert, Autotrader, Indicators, Scan, Screener, Strategy and Signals.
Copyright @ 2023 Patternsmart - All rights reserved
This website is for educational and informational
purposes only and should not be considered a solicitation to buy or sell a
futures contract or make any other type of investment decision. It's not recommended to use any single indicator as sole evaluation criteria. The companies
and services listed on this website are not to be considered a recommendation
and it is the reader's responsibility to evaluate any product, service, or
company. patternsmart is not responsible for the accuracy or content of any
product, service or company linked to on this website.
Futures trading
contains substantial risk and is not for every investor.Please read the following risk disclosure before considering the
trading of this product:
Futures Risk Disclosure. An investor could
potentially lose all or more than the initial investment. Risk capital is money
that can be lost without jeopardizing ones financial security or life style.
Only risk capital should be used for trading and only those with sufficient risk
capital should consider trading. Past performance is not necessarily indicative
of future results.
Trading stocks, options, futures and forex involves
speculation, and the risk of loss can be substantial.Investor must consider all
relevant risk factors, including their own personal financial situation, before
trading. Trading foreign exchange on margin carries a high level of risk, as
well as its own unique risk factors. Forex investments are subject to
counter-party risk, as there is no central clearing organization for these
transactions. Please read the following risk disclosure before considering the
trading of this product:
Forex Risk Disclosure. Spreads, Straddles, and other multiple-leg option
strategies can entail substantial transaction costs, including multiple
commissions, which may impact any potential return. Options are not suitable for
all investors as the special risks inherent to options trading may expose
investors to potentially rapid and substantial losses. Prior to trading options,
you should carefully read
Characteristics and Risks of Standardized Options.
patternsmart.com
will not be held liable for the loss of money or any damage caused from relying
on the information on this site. Any investment decision you make in your account is solely your responsibility.
TESTIMONIAL DISCLOSURE: TESTIMONIALS APPEARING ON OUR SITE MAY NOT BE REPRESENTATIVE OF THE EXPERIENCE OF OTHER CLIENTS OR CUSTOMERS AND IS NOT A GUARANTEE OF FUTURE PERFORMANCE OR SUCCESS.