Your shopping cart is empty!
Shopping Cart
0 item(s) - FreeCustomization and Conversion for: MetaTrader(MT4, MT5), Thinkorswim, NinjaTrader, MultiCharts, Tradingview, Prorealtime, SierraChart, etc.
License renew price will be 20% off for the 2nd year and after.
Featured
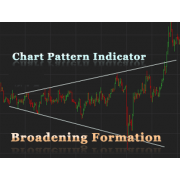


Broadening Formation chart pattern indicator with alert for tradingview

") (
(Please note that this purchase is a 1-Year license. About License renew.
This indicator automatically detects broadening formation for you. Follow the guidelines below to set you the parameters to your liking. It works for all timeframes
Input
Broadening Formation
.png)
Description
A broadening formation is a price chart pattern that consists of two trend-lines, where the upper and lower trend lines gradually diverge from each other and formed a shape that looks like a megaphone, so sometimes people also call this pattern as a megaphone pattern or inverted triangle pattern. The distinctive characteristic of this formation is the highs are getting higher and higher and the lows are getting lower and lower, with at least two higher highs and two lower lows. Eventually, the price falls below the lower trend lines or break through the upper trade lines, known as Bearish broadening formation or Bullish broadening formation respectively.
.png)
Reason/Mechanism
The megaphone shape is caused by investor impulse and irrational emotions. When stock prices rise at times, buyers chase the rise wildly, and when the price fell, the seller takes over the control and blindly drive the price down. Through the battle between bulls and bears, the market sees higher highs and lowers lows are formed. The broadening formation is a product of emotional and irrational market, reflecting unstable trading mood of investment. It’s usually happened at the end of a long-term upward phase, when investors are infected by the fierce speculation in the market and started behaving impulsively, after the back-and-forth fluctuations, the bears ultimately gained the upper hand and took the price down. On the flip side, in case of bullish broadening formation, we typically see two higher highs and three lower lows with the third price swing breaks through the upper trend line.
.png)
Applications
It’s not very common for this pattern to form, and when it does, it usually means the market is in high volatility, so it’s important for investors to understand the various characteristics and operating rules of this pattern.
Broadening formation at top: the sign of the completion of the typical megaphone top has three highs (one higher than prior) and two lows (one lower than the other). When the peaks are formed and price started to go down, it could signal a reversal, and can be a profit taking points to exit the market, especially after a long period of upward trend. An interesting point to notice is that once the pattern has formed, the price at this time will often rebound under the efforts of many parties, and the strength of this rebound can be significant, may even be close to the distance of ½ between the last high and low points. It’s often argued that as long as the price rebound does not exceed the middle point between last high and last low, it can determine the pattern is completed, and price will soon start a long period of decline. It can be understood as the final madness has pushed the price to a very high level, but it also implies the buyers in the market has been fully utilized, and the upward trend has come to an end. If, however, the price rebound surpassed the middle level, it usually means in this new round of battle between bulls and bears, the bulls have regained their strength and won a temporary victory, it will be difficult to predict who will triumph. Nonetheless, the possibility for this sizeable rebound to happen is rare with broadening formation at the top of the market.
Broadening formation at bottom: this pattern is often considered as a bullish signal and indicates the current downward trend may reverse and form a new upward trend. It usually consists of at least two higher highs and two lower lows, and the pattern is completed when the price has exceeded the previous two peaks. During the formation of the pattern, the volume usually at its high level and very irregular and unpredictable, but it can be helpful in some cases, if the volume of the third swing down is shrinking, and the price breaks out upward with a large volume, it usually shows the future price increase can be very substantial.
.png)
Swing trading with upper and bottom trend lines as resistance and support level. Great opportunities lie with broadening formation. Just to give a few ideas, for broadening top pattern, a trader can exit its long position when price reaches the upper trend line (resistance line) for profit taking and stop the loss when price fall through the lower trend line (support line). For broadening bottom, a trader can start a long position when price breaks above the upper trend line (resistance line), now the resistance line becomes a new support level and take the profit at the point where the price is equal to the difference between the highest high and lowest low. Stop loss can be placed at middle line or Fibonacci retraction level. The trading strategy can be plenty, broadening formation means that the market is indecisive and is looking for directions, which presents many opportunities when the market is volatile.
.png)
The picture below shows a pattern to begin from a swing low.
.png)
The picture below shows a pattern to begin from a swing high.
.png)
.png)
This indicator automatically detects broadening formation for you. Follow the guidelines below to set you the parameters to your liking. It works for all timeframes
Input
Broadening Formation
Description
A broadening formation is a price chart pattern that consists of two trend-lines, where the upper and lower trend lines gradually diverge from each other and formed a shape that looks like a megaphone, so sometimes people also call this pattern as a megaphone pattern or inverted triangle pattern. The distinctive characteristic of this formation is the highs are getting higher and higher and the lows are getting lower and lower, with at least two higher highs and two lower lows. Eventually, the price falls below the lower trend lines or break through the upper trade lines, known as Bearish broadening formation or Bullish broadening formation respectively.
Reason/Mechanism
The megaphone shape is caused by investor impulse and irrational emotions. When stock prices rise at times, buyers chase the rise wildly, and when the price fell, the seller takes over the control and blindly drive the price down. Through the battle between bulls and bears, the market sees higher highs and lowers lows are formed. The broadening formation is a product of emotional and irrational market, reflecting unstable trading mood of investment. It’s usually happened at the end of a long-term upward phase, when investors are infected by the fierce speculation in the market and started behaving impulsively, after the back-and-forth fluctuations, the bears ultimately gained the upper hand and took the price down. On the flip side, in case of bullish broadening formation, we typically see two higher highs and three lower lows with the third price swing breaks through the upper trend line.
Applications
It’s not very common for this pattern to form, and when it does, it usually means the market is in high volatility, so it’s important for investors to understand the various characteristics and operating rules of this pattern.
Broadening formation at top: the sign of the completion of the typical megaphone top has three highs (one higher than prior) and two lows (one lower than the other). When the peaks are formed and price started to go down, it could signal a reversal, and can be a profit taking points to exit the market, especially after a long period of upward trend. An interesting point to notice is that once the pattern has formed, the price at this time will often rebound under the efforts of many parties, and the strength of this rebound can be significant, may even be close to the distance of ½ between the last high and low points. It’s often argued that as long as the price rebound does not exceed the middle point between last high and last low, it can determine the pattern is completed, and price will soon start a long period of decline. It can be understood as the final madness has pushed the price to a very high level, but it also implies the buyers in the market has been fully utilized, and the upward trend has come to an end. If, however, the price rebound surpassed the middle level, it usually means in this new round of battle between bulls and bears, the bulls have regained their strength and won a temporary victory, it will be difficult to predict who will triumph. Nonetheless, the possibility for this sizeable rebound to happen is rare with broadening formation at the top of the market.
Broadening formation at bottom: this pattern is often considered as a bullish signal and indicates the current downward trend may reverse and form a new upward trend. It usually consists of at least two higher highs and two lower lows, and the pattern is completed when the price has exceeded the previous two peaks. During the formation of the pattern, the volume usually at its high level and very irregular and unpredictable, but it can be helpful in some cases, if the volume of the third swing down is shrinking, and the price breaks out upward with a large volume, it usually shows the future price increase can be very substantial.
Swing trading with upper and bottom trend lines as resistance and support level. Great opportunities lie with broadening formation. Just to give a few ideas, for broadening top pattern, a trader can exit its long position when price reaches the upper trend line (resistance line) for profit taking and stop the loss when price fall through the lower trend line (support line). For broadening bottom, a trader can start a long position when price breaks above the upper trend line (resistance line), now the resistance line becomes a new support level and take the profit at the point where the price is equal to the difference between the highest high and lowest low. Stop loss can be placed at middle line or Fibonacci retraction level. The trading strategy can be plenty, broadening formation means that the market is indecisive and is looking for directions, which presents many opportunities when the market is volatile.
Features and inputs:
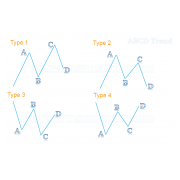
- Choose between two different types of Broadening Formation, pattern begin from either swing high or swing low.
- Strength input is the number of bars used to form each top.
- Adjust the number of bars to extend the trend line to the right side.
- Change the color of label and trend line.
- Alert when a pattern is formed.
The picture below shows a pattern to begin from a swing low.
The picture below shows a pattern to begin from a swing high.
How to set up alert:
- Click the alert icon from the top tool strip.
- Choose Broadening Formation in Condition.
- Choose Broadening Formation in subsection of Condition.
Please make sure to use the exactly same steps above in order to get the alert working properly.
You may need to restart tradingview if you couldn't set up alert.
Write a review
Your Name:Your Review: Note: HTML is not translated!
Rating: Bad Good
Enter the code in the box below:


Latest


Welcome to Patternsmart
Converting your indicator from one platform to another.Custom Alert, Autotrader, Indicators, Scan, Screener, Strategy and Signals.
Copyright @ 2023 Patternsmart - All rights reserved
This website is for educational and informational
purposes only and should not be considered a solicitation to buy or sell a
futures contract or make any other type of investment decision. It's not recommended to use any single indicator as sole evaluation criteria. The companies
and services listed on this website are not to be considered a recommendation
and it is the reader's responsibility to evaluate any product, service, or
company. patternsmart is not responsible for the accuracy or content of any
product, service or company linked to on this website.
Futures trading
contains substantial risk and is not for every investor.Please read the following risk disclosure before considering the
trading of this product:
Futures Risk Disclosure. An investor could
potentially lose all or more than the initial investment. Risk capital is money
that can be lost without jeopardizing ones financial security or life style.
Only risk capital should be used for trading and only those with sufficient risk
capital should consider trading. Past performance is not necessarily indicative
of future results.
Trading stocks, options, futures and forex involves
speculation, and the risk of loss can be substantial.Investor must consider all
relevant risk factors, including their own personal financial situation, before
trading. Trading foreign exchange on margin carries a high level of risk, as
well as its own unique risk factors. Forex investments are subject to
counter-party risk, as there is no central clearing organization for these
transactions. Please read the following risk disclosure before considering the
trading of this product:
Forex Risk Disclosure. Spreads, Straddles, and other multiple-leg option
strategies can entail substantial transaction costs, including multiple
commissions, which may impact any potential return. Options are not suitable for
all investors as the special risks inherent to options trading may expose
investors to potentially rapid and substantial losses. Prior to trading options,
you should carefully read
Characteristics and Risks of Standardized Options.
patternsmart.com
will not be held liable for the loss of money or any damage caused from relying
on the information on this site. Any investment decision you make in your account is solely your responsibility.
TESTIMONIAL DISCLOSURE: TESTIMONIALS APPEARING ON OUR SITE MAY NOT BE REPRESENTATIVE OF THE EXPERIENCE OF OTHER CLIENTS OR CUSTOMERS AND IS NOT A GUARANTEE OF FUTURE PERFORMANCE OR SUCCESS.