Popular tags: Support, Resistance, Trend, Range, Fibonacci, Wave, Divergence, Multi time frames(MTF), Swing, Volume, Overbought, Oversold
Customization and Conversion for: MetaTrader(MT4, MT5), Thinkorswim, NinjaTrader, MultiCharts, Tradingview, Prorealtime, SierraChart, etc.
License renew price will be 20% off for the 2nd year and after.


Stochastics divergence indicator with alert for NinjaTrader 8.

Stochastics divergence indicator with alert for NinjaTrader 8.
Availability: In Stock
Price: $99.00USD $60.00USD

Available Options


* NinjaTrader Login Email:

Qty:     - OR -   Add to Wish List
Add to Compare
0 (0/5)  0 reviews  |  Write a review

Please note that this purchase is a 1-Year license. About License renew.

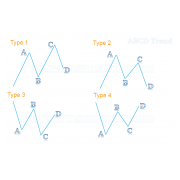
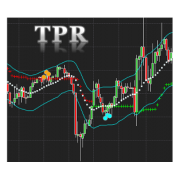
Divergence is very common and useful in technical analysis. It indicates possible reversal signals when there are discrepancies between Stochastics and price movement.

Stochastic divergence is a powerful tool for traders because it signals potential trend exhaustion and upcoming reversals before they become obvious on the price chart. Here's why it's useful:

  1. Early Warning Signal:

    • Divergence occurs when the price makes a new high/low, but the Stochastic Oscillator fails to confirm it with a corresponding new high/low in its reading.

    • This indicates that the underlying momentum driving the price move is weakening, even though the price itself is still pushing to new extremes. It often foreshadows a reversal before the price action itself definitively turns.

  2. Identifies Potential Reversal Points:

    • Regular Bearish Divergence: Price makes a higher high, but Stochastic makes a lower high. This signals weakening upside momentum and a potential downturn.

    • Regular Bullish Divergence: Price makes a lower low, but Stochastic makes a higher low. This signals weakening downside momentum and a potential upturn.

    • Spotting these divergences helps traders anticipate where a trend might stall and reverse, identifying potential entry (bullish divergence) or exit/shorting (bearish divergence) opportunities.

  3. Helps Avoid False Breakouts/Fakeouts:

    • When price makes a new high (like breaking above resistance) or a new low (like breaking below support), but the Stochastic shows divergence, it warns that the breakout might lack conviction and could fail. This can prevent traders from entering trades based on false signals.

  4. Confirms Trend Strength/Weakness:

    • The absence of divergence during a strong trend (price and Stochastic consistently making new highs/lows together) confirms the trend's health.

    • Conversely, the presence of divergence objectively quantifies the growing weakness within an ongoing trend.

  5. Complements Overbought/Oversold Signals:

    • While Stochastic readings above 80 (overbought) or below 20 (oversold) are common signals, they can persist for a long time in strong trends. Divergence adds crucial context:

      • An overbought reading with bearish divergence is a much stronger signal for a potential pullback than an overbought reading alone.

      • An oversold reading with bullish divergence is a much stronger signal for a potential bounce than an oversold reading alone.

Visual Example:

  1. Scenario: An uptrend.

  2. Price Action: Makes a new high (Higher High - HH).

  3. Stochastic Action: Fails to make a new high; its peak is lower than the previous peak (Lower High - LH).

  4. Interpretation (Bearish Divergence): The uptrend is losing momentum despite the price hitting a new peak. Sellers might be gaining control. A potential reversal down is likely.

  5. Trader Action: Consider taking profits on long positions, tightening stops, or potentially initiating a short position (especially if confirmed by other signals like price breaking a trendline or bearish candlestick patterns).

Important Considerations & Limitations:

  • Not a Standalone Signal: Divergence is best used in conjunction with other technical analysis tools:

    • Price Action: Support/Resistance levels, trendlines, chart patterns (head & shoulders, double tops/bottoms).

    • Volume: Increasing volume on the reversal move confirms the divergence signal.

    • Other Indicators: RSI, MACD, Moving Averages.

    • Candlestick Patterns: Reversal candles (shooting star, hammer, engulfing patterns) at the divergence point add weight.

  • False Signals: Divergence can sometimes appear, but the trend continues. This is more common in very strong trending markets. Confirmation is key.

  • Timing: Divergence signals a potential reversal, but it doesn't predict when it will happen. The reversal could take time to materialize.

  • Type Matters: Understand the difference between regular (reversal) and hidden (continuation) divergence.

  • Timeframe: Divergence on longer timeframes (Daily, Weekly) is generally more reliable than on shorter timeframes (5-min, 15-min).

Stochastic divergence is useful because it provides traders with an early, objective signal of weakening momentum within a trend. This allows them to:

  • Anticipate potential reversals for better entry/exit timing.

  • Avoid chasing breakouts that lack momentum (false breakouts).

  • Manage risk by signaling when a trend might be running out of steam.

  • Gain confidence in overbought/oversold signals when divergence is present.

By incorporating divergence analysis into your trading strategy alongside other confirming factors, you significantly improve your ability to identify high-probability trading opportunities and manage risk effectively. Remember, it's a warning light, not a crystal ball – always wait for confirmation.

Features and inputs:

  1. Instant signal on current (last) bar, no repaint.
  2. Three range mode:Short, Mid and Long to check divergence.
  3. Four plots can be used from other NinjaScript: Bullish Regular Signal, Bearish Regular Signal, Bullish Hidden Signal and Bearish Hidden Signal
  4. Alert when a signal appears.
  5. Select different sound alert files.
  6. Enable to show lines between Highs and Lows.
  7. Please note: it doesn't work in Renko chart.
  8. Market Analyzer with alert. You can add new sound files to your NT8\sounds directory.
  9. Wait 1 bar: enable this new feature will display the signal 1 bar later in order to check the trend direction of both price and related indicator, otherwise, it will display the signal on current bar. We consider this feature as a 1 bar confirmation for divergence signals.
It will detect both regular and hidden divergence between price trend and indicator value.

There are four plots (Bullish Regular Signal, Bearish Regular Signal, Bullish Hidden Signal and Bearish Hidden Signal) that can be used from other Ninjatrader functions, such as Market Analyzer and strategy builder.
 
A hidden divergence is where price has a higher Low, but the indicator has a relative lower value.
Or if price has a lower High, but the indicator has a relative higher value.

There will be a 'H' drawn under a hidden divergence.

A 'R' drawn under a regular divergence.


Write a review

Your Name:


Your Review: Note: HTML is not translated!

Rating: Bad           Good

Enter the code in the box below:


Welcome to Patternsmart
Converting your indicator from one platform to another.

Custom Alert, Autotrader, Indicators, Scan, Screener, Strategy and Signals.


Copyright @ 2025 Patternsmart - All rights reserved


This website is for educational and informational purposes only and should not be considered a solicitation to buy or sell a futures contract or make any other type of investment decision. It's not recommended to use any single indicator as sole evaluation criteria. The companies and services listed on this website are not to be considered a recommendation and it is the reader's responsibility to evaluate any product, service, or company. patternsmart is not responsible for the accuracy or content of any product, service or company linked to on this website.

Futures trading contains substantial risk and is not for every investor.Please read the following risk disclosure before considering the trading of this product: Futures Risk Disclosure. An investor could potentially lose all or more than the initial investment. Risk capital is money that can be lost without jeopardizing ones financial security or life style. Only risk capital should be used for trading and only those with sufficient risk capital should consider trading. Past performance is not necessarily indicative of future results.

Trading stocks, options, futures and forex involves speculation, and the risk of loss can be substantial.Investor must consider all relevant risk factors, including their own personal financial situation, before trading. Trading foreign exchange on margin carries a high level of risk, as well as its own unique risk factors. Forex investments are subject to counter-party risk, as there is no central clearing organization for these transactions. Please read the following risk disclosure before considering the trading of this product: Forex Risk Disclosure. Spreads, Straddles, and other multiple-leg option strategies can entail substantial transaction costs, including multiple commissions, which may impact any potential return. Options are not suitable for all investors as the special risks inherent to options trading may expose investors to potentially rapid and substantial losses. Prior to trading options, you should carefully read Characteristics and Risks of Standardized Options.

patternsmart.com will not be held liable for the loss of money or any damage caused from relying on the information on this site. Any investment decision you make in your account is solely your responsibility.
TESTIMONIAL DISCLOSURE: TESTIMONIALS APPEARING ON OUR SITE MAY NOT BE REPRESENTATIVE OF THE EXPERIENCE OF OTHER CLIENTS OR CUSTOMERS AND IS NOT A GUARANTEE OF FUTURE PERFORMANCE OR SUCCESS.