永久使用许可证, 价格:¥1200
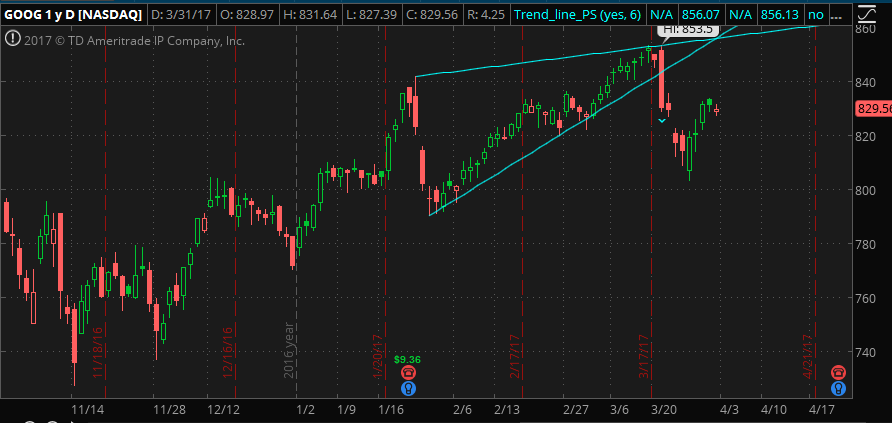
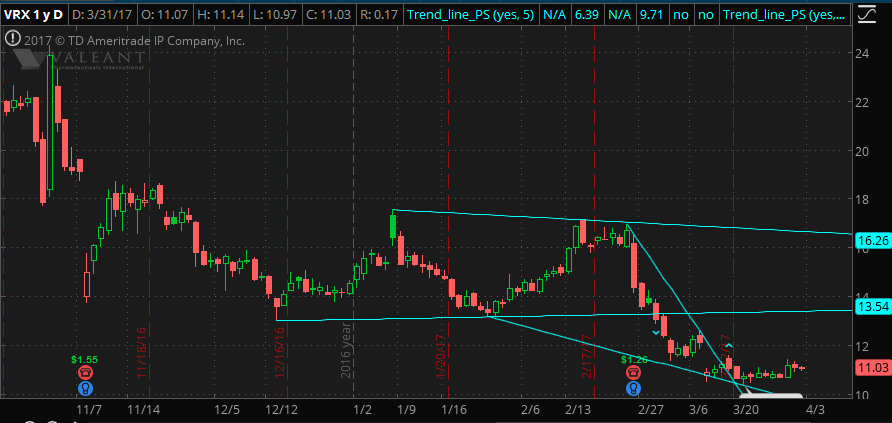
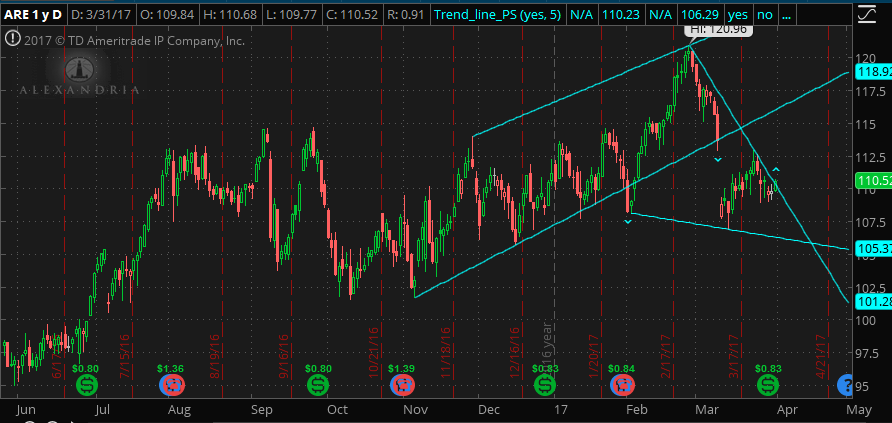
该软件包包括Thinkorswim TOS自动趋势线指标器,趋势线突破扫描和监视列表的自定义报价。
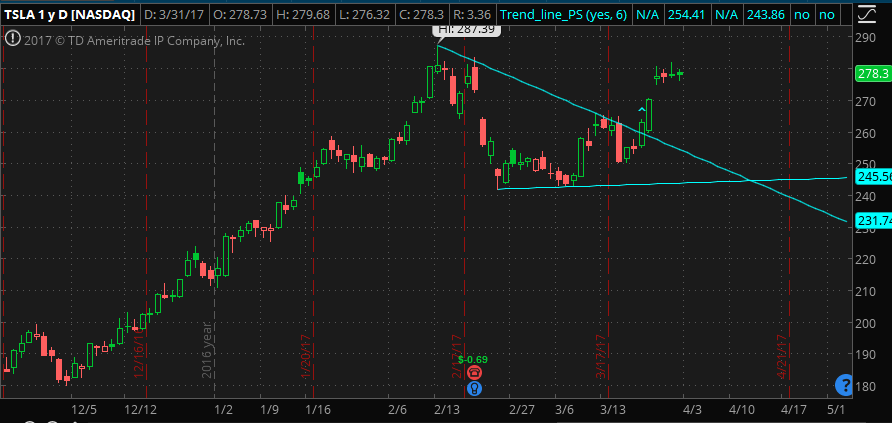
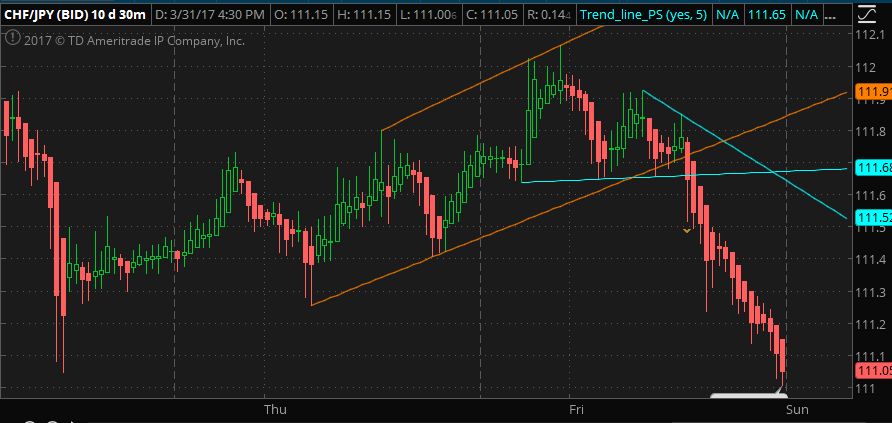
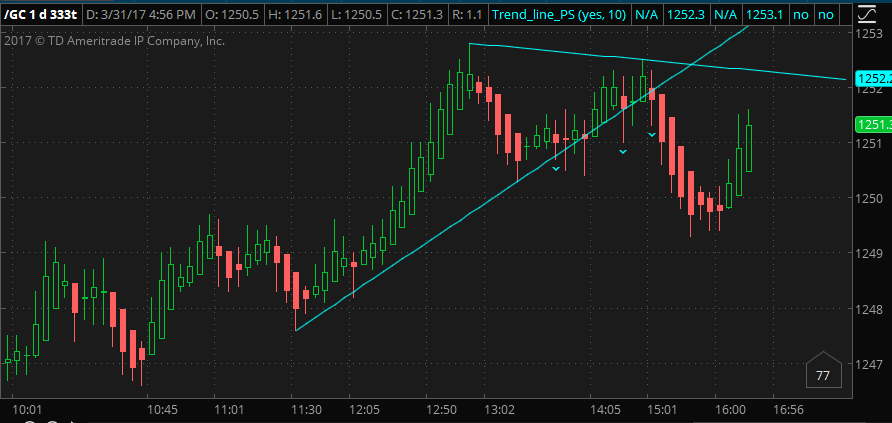
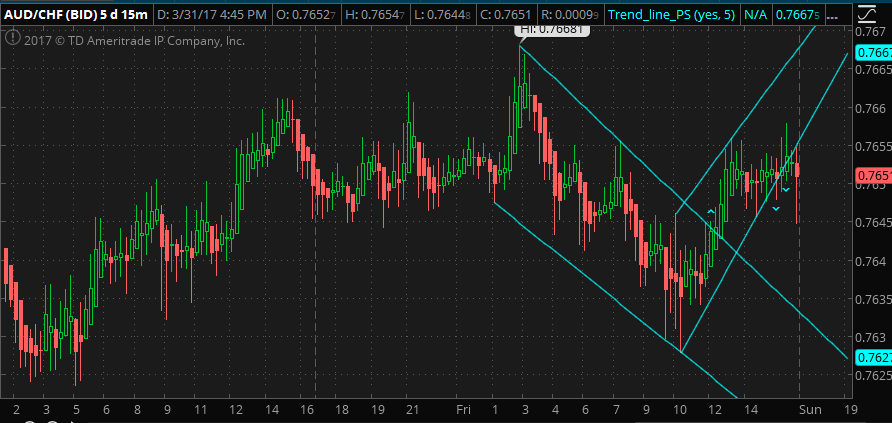
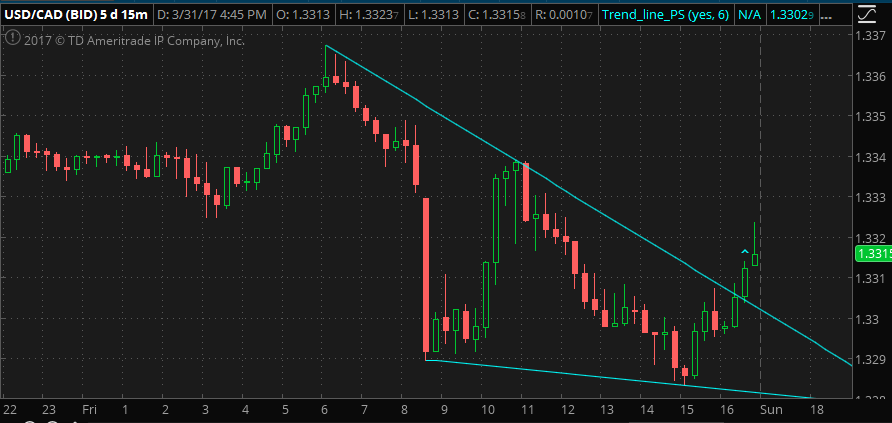
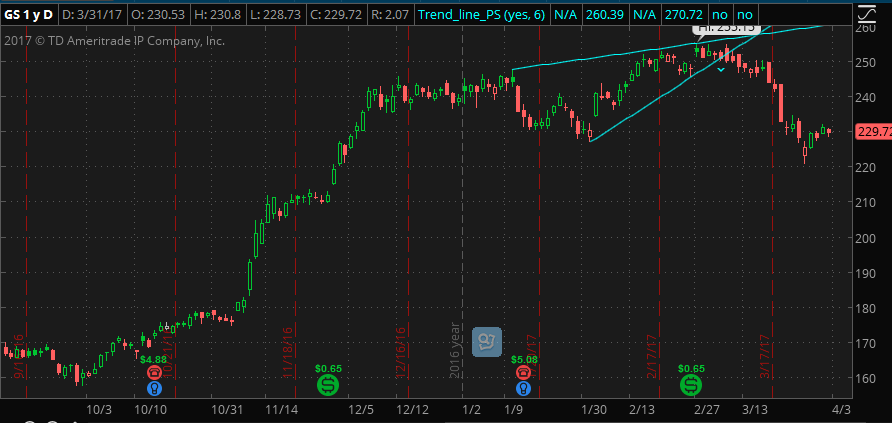
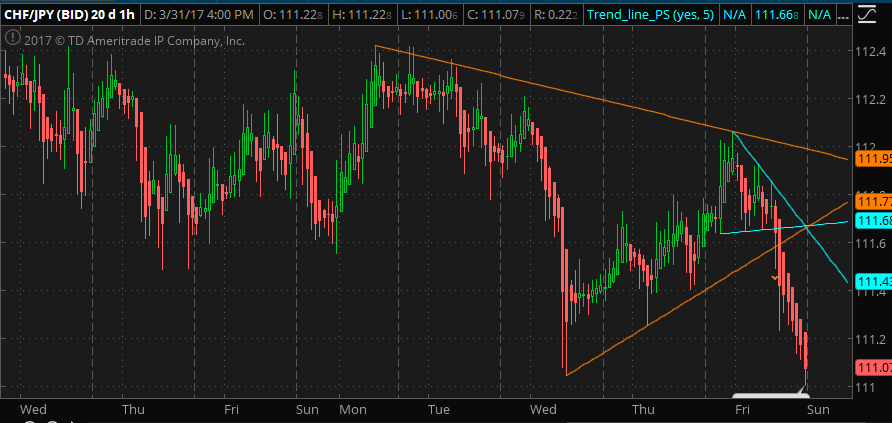
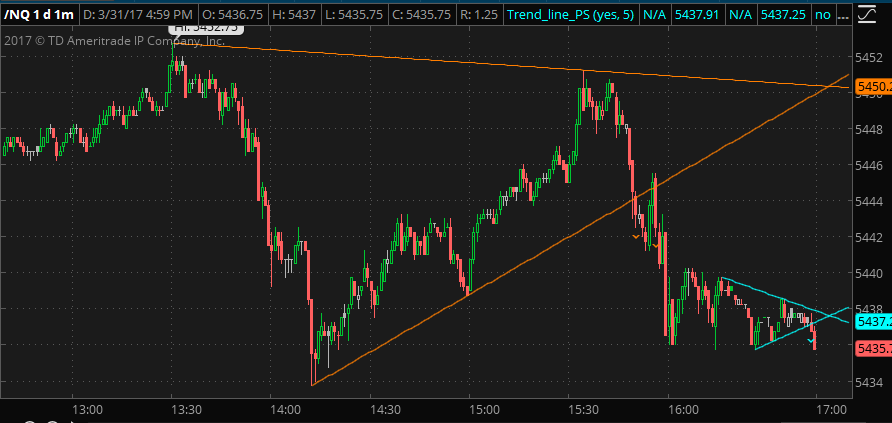
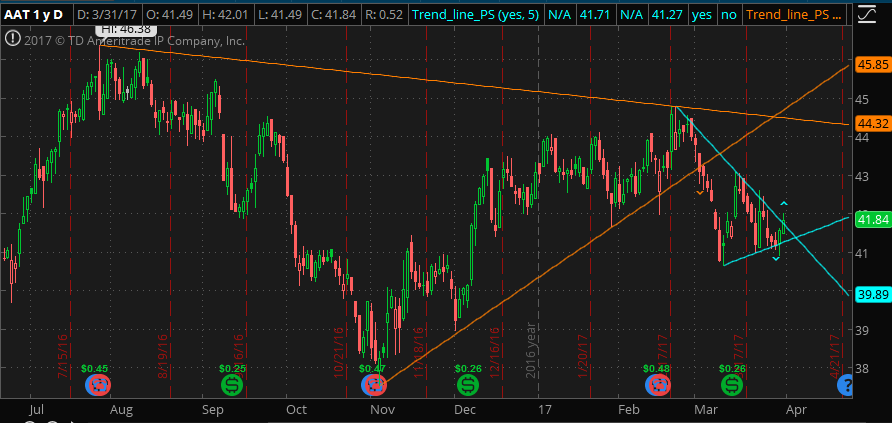
趋势线指标器绘制上升趋势线和下降趋势线。
价格上方的线是由两个近期摆动高点形成的,价格下方的线是由两个近期摆动低点形成的。

您将能够定义上下波动的强度,以便检测长期,中期和短期趋势线。输入的强度是摆动点左侧和右侧的条形数量。
当价格超过趋势线上限或低于趋势线下限时,它将发出警报。
它适用于任何时间范围和各种证券(股票,外汇,期货等)
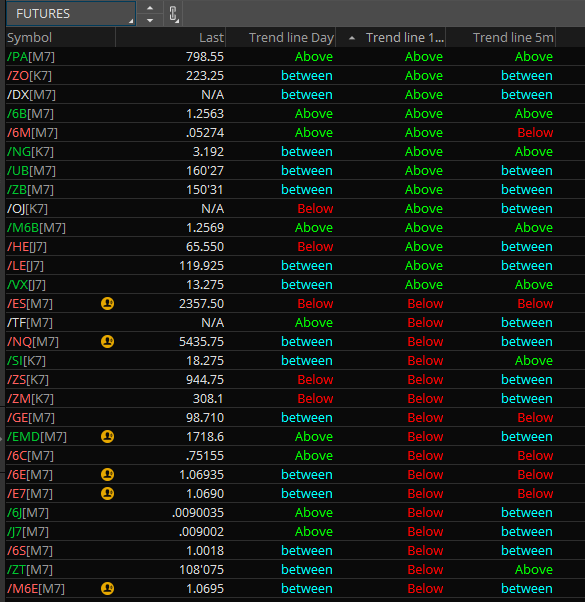
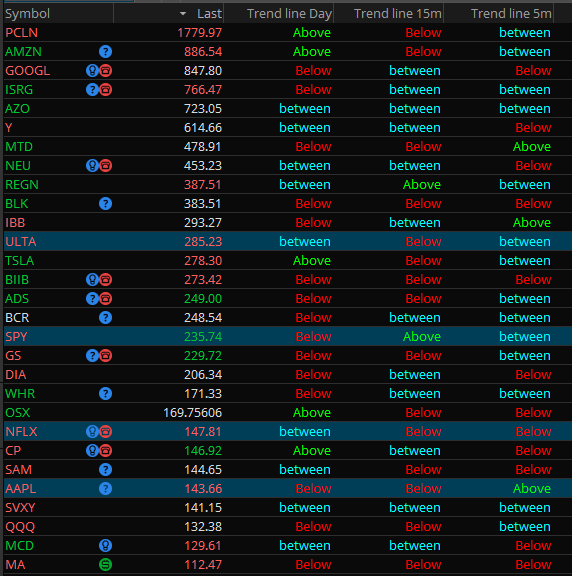
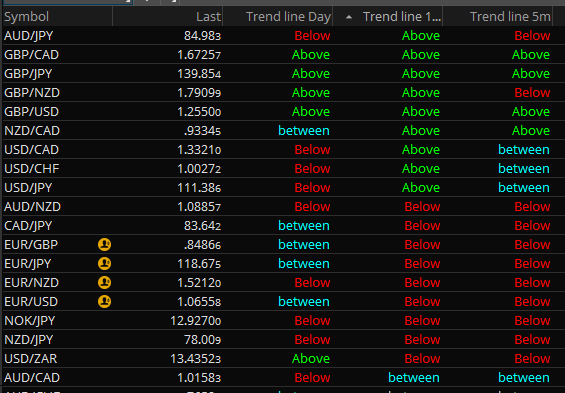
趋势线SCAN将搜索并找到所有最近价格在上趋势线上方或下趋势线下方收盘的交易品种。
扫描和定制报价也可以定制以满足您的要求。
您始终可以使用不同的“强度”设置多次应用此指标,以检测同一图表上的长期,中期和短期趋势线。例如,您可以使用强度= 6的一个和强度= 12的另一个。实际上,您可以随意添加多次,就像移动平均指标一样。
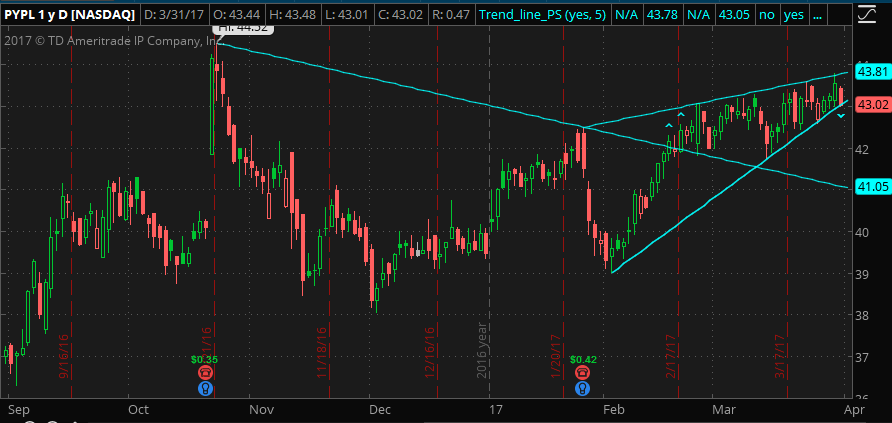
The custom quote will show the relative position of current price in watchlist.
If Close is above the upper trend line, it will show “Above”
If Close is below the lower trend line, it will show “Below”
If Close is between the upper and lower trend line, it will show “Between”
You can apply it to more than one column with different timeframe.
Looks cool. How do I get a copy of the script?
Please purchase it from http://www.patternsmart.com/cart/index.php?route=product/product&product_id=374&search=auto+trend